Friday, April 8, 2011
To fade or not to fade today's likely up gap??
The stats for fading today's up gap is not great in my opinion and given a large part of yesterdays sell off was caused by the news of another earthquake in Japan. My best guess about the ensuing day structure on the futures is that buyers will immediately come in on the open and bid the market higher and possibly test the recent highs. Whether we see any buyers show up at this level is yet to be seen as we have sold off from the highs for the last 3 or 4 days. A good trade is probably to wait and fade yesterday's highs on the ES at 1335 with a tight stop. Internals weren't really bearish for yesterday given the 30 mins of panic.


Dollar weakness
The dollar index is extremely close to breaking a major swing low here. This is causing a major rally in gold, oil and everything else that is negatively correlated with it. No doubt a major contribution to the sell off has been caused by the rate rise in the Euro which makes up a large component of the dollar index. Next stop is the low that was made back in Dec 2009. Bonds are also selling off and yields are rising (which in the longer term should be supportive of the dollar but of course we all know that Ben and the Fed ain't raising rates till at least the end of the year). To me it's clear that so long as the USD and the Yen remain in bearish trends, the carry trade (ie borrow USD and Yen and buy everything else) will be the norm. This should see a continued rise in all risk assets.
Tuesday, April 5, 2011
Morning market update
The gap filled pretty easily this morning and we are seeing quite strong tick readings thus far (+16,000). It would appear that the market really liked that ISM number. I still think it will be a two sided day today as the breadth on both the NYSE and Nas is fairly weak. However a look at all other assets has seen everything pop quite strongly. The dollar which was strong heading into the open has sold off pretty hard. The risk trade seems to be back on. One bit of divergence is the Nasdaq which is showing a bit of relative weakness.
Pre-market thoughts 5th April 2011
Looking for a good entry to get short today on a day trade (probably fading the gap fill). Volume has dried up considerably (lowest in 2 months on yesterdays session). Also there is a bit of uncertainty out there with the US debt limit situation and the ECB rate announcement on Thursday.
Confirming indicators or assets are that bonds have stayed strong and other risk assets have come off it's highs. Technically the market is overbought and I see some resistance at these levels on the ES.
Quant studies are also confirming the short term bearish bias. In terms of market structure we had a fairly convictionless trade yesterday and the Open could be classified as a Open-Rejection-Reverse (for more refer to Mind over Markets trading book). Pattern wise, it was an inside day yesterday on the ES so watch for a breakout if we do not hold the extremes from the last couple of days. I'm favoring the downside here.
Market internals also reflected the lack of conviction as A/D lines or breadth (yes that is the correct term I've realised) finishing flat along with up volume versus down volume. Cumulative also finished at +6000 but this is considered a neutral number.
If the ECB does raise rates, then that could make things very interesting! I don't the market will like it is my gut feeling.
Trade safe!
Confirming indicators or assets are that bonds have stayed strong and other risk assets have come off it's highs. Technically the market is overbought and I see some resistance at these levels on the ES.
Quant studies are also confirming the short term bearish bias. In terms of market structure we had a fairly convictionless trade yesterday and the Open could be classified as a Open-Rejection-Reverse (for more refer to Mind over Markets trading book). Pattern wise, it was an inside day yesterday on the ES so watch for a breakout if we do not hold the extremes from the last couple of days. I'm favoring the downside here.
Market internals also reflected the lack of conviction as A/D lines or breadth (yes that is the correct term I've realised) finishing flat along with up volume versus down volume. Cumulative also finished at +6000 but this is considered a neutral number.
If the ECB does raise rates, then that could make things very interesting! I don't the market will like it is my gut feeling.
Trade safe!
Thursday, March 31, 2011
This can't continue indefinitely.......
Further to my previous post, the current move cannot continue forever as expectations of greater liquidity and thus inflation will indeed become self fulfilling causing central banks to begin to raise rates. Of course they will err on the side of caution then risk raising rates too early so expect a continued rise in risk assets.
Oh by the way, quant studies continue to point to higher prices, 3 months to 1 year out.
Oh by the way, quant studies continue to point to higher prices, 3 months to 1 year out.
Current market thoughts & observations
As you all know the market has been trending higher and is exhibiting very bullish tape action. My thoughts are that we are going to continue to see more stimulus from central banks and continued liquidity in the form of bailouts etc etc. This is all reinforcing the risk trade and that's why we continue to see equity markets higher, oil higher, gold higher etc etc even though fundamentally something like oil really shouldn't be higher given that inventories came in yesterday well above expectations (2.9 mil versus 1.6 mil). The mentality of late that I've been seeing in the early morning futures trade has been to wait for the flush out early in the morning and then buy the lows as we have ripped every time.
Really, really tough to trade option income trades in this environment in my opinion. The best trades for the last 2 weeks have been to sell puts or buy call spreads. I will update later with a trade that I have on the SPX which is a unbalanced iron condor but I have had to keep massaging it by buying call spreads just to keep the deltas in line with my theta. At this point, we are so close to retesting the recent highs of 1344 on the SPX that it would absolutely shock me that we don't get there. I think it's a given that the market wants to go there. This might set up some interesting spec trades like long some cheap out the money call spreads as we head into the last 2 weeks of expiration.
Really, really tough to trade option income trades in this environment in my opinion. The best trades for the last 2 weeks have been to sell puts or buy call spreads. I will update later with a trade that I have on the SPX which is a unbalanced iron condor but I have had to keep massaging it by buying call spreads just to keep the deltas in line with my theta. At this point, we are so close to retesting the recent highs of 1344 on the SPX that it would absolutely shock me that we don't get there. I think it's a given that the market wants to go there. This might set up some interesting spec trades like long some cheap out the money call spreads as we head into the last 2 weeks of expiration.
Thursday, March 10, 2011
Mass liquidation??
A bit of risk aversion all across the board. Everything that has probably been bought on leverage is starting to unwind and that includes crude, gold, silver etc etc. All market internals are solidly negative. In fact they stink and the robots (ie program buying) that have bought at low levels on each time we've had weakness lately are now where to be seen. Ticks are solidly negative and cumulatively we are down -20,000 already. Seeing a massive jump in volume today which shows that a lot of distribution is going on. I myself did go with the open but I did fade the first bounce we got on the TF for a nice winner. I don't think we will see any meaningful bounces today to be honest. Still you never know with this market. Very quiet in the pits though so not a sign that we've hit some sort of extreme just yet (normally lots of noise indicates that selling or buying is reaching an extreme). Treasuries and the dollar are up so definitely some safe haven allocation going on.
Back to regular programming soon!
Hi folks,
I've been a bit busy lately since I got back from holidays and I haven't yet gotten into the blogging mood but I will rectify this over the weekend. Current thoughts are:
I've been a bit busy lately since I got back from holidays and I haven't yet gotten into the blogging mood but I will rectify this over the weekend. Current thoughts are:
- Very strong inverse correlation between crude futures and the e-minis. The fear to me at this stage seems to be that if we get a large spike in the price of crude, then this may force central bankers to start raising rates earlier than expected. Note that the comments from one of the ECB bankers a couple of days ago really spooked the Euro and it had quite a bit of a meltdown (normally you would have expected the Euro to rise but I guess traders are thinking more about the longer term effects that higher interest rates would have on the struggling PIIGS to repay their debts and what that would mean to the Euro if any one of them defaulted). Any rise in interest rates would signal an end to the flood of liquidity we've had and that would not be good for equities or the global economy as a whole as it is still recovering.
- Based on quant studies such as patterns, the odds still point to a higher market in the intermediate term 3-6 months out. ie any nice pull back or correction sell off is likely to be a good opportunity to get long.
- The short term technical picture for the S&P shows that we are forming a triangle pattern as longs and shorts keep building positions by fading the lows and highs. Watch for an eventual break of this range soon as all we need is a catalyst to make a big push in one direction and one side is forced to cover. I might make a separate post about this.
- We've had some pretty good distribution days of late as seen by cumulative tick action (there's been 3 days over the last 2 weeks where we had more than -60,000 in cumulative ticks).
- Each day that we begin with a weak opening and a bit of a sell off, I've observed program buying stepping in and pushing the market back higher again at key levels. How do I know?? Because I keep hearing alerts on my trading platform when I get spikes in NYSE tick action of +600 to +1000. How long does this last I do not know
- We are seeing large gap downs in the overnight futures right now below the low of the cash session. This presents a high probability that the gap will not fill and is suggestive of a continuation move down in the cash session. It will be interesting to see whether the low of a few days ago, 1302 in the ES, holds.
Thursday, February 24, 2011
Will be away for a few days
There will be no posts for the next few days as I'm on vacation.
Safe trading everyone!
Wednesday, February 23, 2011
The selling did come but not before I went to bed!
In hindsight, I totally mucked up yesterday's short trade. After stating that I would likely fade the gap fill and that the suckers would try and buy the opening weakness and push the market higher, I went short right at the open with a 5 point stop on the ES expecting it to be a full blown trend day. ie sell off from the open and never look back. For the first 5 mins there, it did look that to be the case. However once the paper sellers stopped, the locals who were then all long having absorbed all the supply were able to push higher along with all the gap faders. However the locals then failed to find paper buyers after a nice 6 point run and so were forced to flatten up after that which then took the market lower again. After that it just became an avalanche as those who faded the open began to cover their longs as there were just no buyers to be found. For me the error was due to a couple of things:
- Getting the market structure slightly wrong by not anticipating that there would be an upward bias on the open as weakness of late has been bought. This would have caused me to fade the gap fill at a slightly higher level.
- Setting my stop too tight on a day where we were bound to get an expansion in the range (or volatility)
- Trading the ES instead of the TF as the ES showed remarkable resiliency to the early onslaught. It is likely I would have covered my short position in the TF within the first 5 mins as it absolutely got smacked about 3.5 points.
I will remember this lesson for next time!
Tuesday, February 22, 2011
Absence of paper sellers
No avalanche and the pervasive bullishness continues as the futures hold up. Paper sellers are absent after heavy selling off the open which is why we continue to push higher. I am now stopped out of my ES position after covering about 5 points higher. A nice loss today!
Goldman a big seller in the pits
As expected a lot of "paper sellers" this morning with Goldman selling a couple of thousand off the open. Oddly enough the ES is holding up considerably better than the other e-minis which have now bottomed somewhat but internals are still very weak. I'm short from 1326 on the ES. Should be an interesting session. Watch for a break of the first hour range here. Volume as you would expect is extremely heavy. At this stage, the locals are heavily long after buying from paper so anymore continued selling will create an avalanche of supply and they will be forced to cover, thus pushing the futures lower. At this juncture, the locals will try and push higher from here and try to trigger some buy stops from those that are short (myself included).
Volatility analysis
Well after week of capturing the volatility data from my TOS platform and doing the calcs, I can already notice a few things:
- The VIX is not a very reliable indicator of vols as it finished relatively flat on the week but the at the money implied volatility on March options actually crept higher. Check out Mark's article about this. (Option Pit blog)
- Downside skew has also been picking up. Was this an early indication that the market was pricing in some kind of a sell off and the Libyan situation happened to give it an excuse?
- Contango between March and April term structure is on the increase after the spread was very tight a couple of weeks back. Will this continue as it has remained high over the last 2 years relative to how it normally is or will it come down to these levels again after this sell off? In my opinion I do think that elevated levels of contango will remain for years to come as I still see various and frequent shocks continuing to hit the world's financial markets (I think the world is in longer term a transition period).
18th February 2011 - Market Recap
Cumulative ticks: +35,000 but traded sideways since hitting a peak of 40,000 at 1pm.
A/D: +350 for the NYSE and 0 for the NAS. The NYSE finished off the highs hit at noon of 700 while the NAS was well off the opening print of 700.
Breadth: approx 50% positive for both the NYSE and the NAS. Both basically traded at this level the whole day.
A/D: +350 for the NYSE and 0 for the NAS. The NYSE finished off the highs hit at noon of 700 while the NAS was well off the opening print of 700.
Breadth: approx 50% positive for both the NYSE and the NAS. Both basically traded at this level the whole day.
SPX front month 10 delta put skew: March 160.34% (21.55/13.44)
SPX front month 10 delta call skew: March 89% (10.9/12.24)
SPX Horizontal skew or Front month versus next month: 12.84% (average of March ATM options) versus 14.67% (average of April ATM options).
SPX front month 10 delta call skew: March 89% (10.9/12.24)
SPX Horizontal skew or Front month versus next month: 12.84% (average of March ATM options) versus 14.67% (average of April ATM options).
VIX: 16.43 (-0.16)
SPY volume: Finished 3.5% below the 30 day median average.
Quant Predictions
1-3 days: Bearish in terms of pattern and bearish in terms of seasonals
1-4 weeks: Bullish
3-6 months: Bullish
SPY volume: Finished 3.5% below the 30 day median average.
Quant Predictions
1-3 days: Bearish in terms of pattern and bearish in terms of seasonals
1-4 weeks: Bullish
3-6 months: Bullish
Well on Friday, I faded the morning gap up (as that was what the gap guides provided over at masterthegap.com ) showed to be the best setup. The TF was the weapon of choice because the gaps were quite large and I didn't want to hold for entire gap fill in case we again rallied so the TF being the most leveraged of the e-minis was ideal as the extra leverage would give me a decent profit if I was right and I would be able to get in and out of the trade quickly as I wouldn't have to hold it for too long in case I was wrong. As it turned out I went short at 835.20 and covered at 833.20 for 2 points or $200 per contract right after the first 10 mins of the open. Thankfully I covered because after the first 20 mins after the open all of the futures bottomed and rallied higher till noon from when it preceded to sell off into the close right back to where it opened. This kind of pattern is unusual and perhaps it is a clue that some of the longer term time frame traders have hit their targets. Either that or some people knew that the situation in the Middle East was going to unravel over the weekend and no one wanted to hold positions over the long weekend. (Maybe Goldman knew as it was a quiet big seller on Thursday according to Ben from Trader's Audio).
I expect some big time selling tonight as people bail on positions so will likely be fading the gap fill.
Large down gaps in the futures
Seeing a lot of risk aversion at the moment largely sparked by the situation in the Middle East. Futures are well down at the moment and as I've pointed out many times in the past that when you have very large gaps >0.5% and gaps that open above the highs or below the lows of the previous session, the odds of gap fill are low whilst the chance of a trending day is high. Therefore the best trade should we open around here (<1336 on the ES) is to fade the "gap fill" ie go with the direction of the gap. No doubt there will be a lot of the amateurs trying to buy this open and early morning weakness expecting us to rally as we have done for the last 2 weeks or so but I expect these "suckers" to get run over. I will be listening to Ben from Trader's Audio for clues to see whether the big institutions are net buyers or sellers off the open. I expect them to be net sellers in a big way meaning the locals will be forced to cover as the supply will become too much for them to hold.
Thursday, February 17, 2011
16th February 2011 - Market Recap
Cumulative ticks: +15,000 but off the early morning highs of 20,000
A/D: 1300 for the NYSE and 800 for the NAS. Both A/D lines again trading off the morning highs.
Breadth: approx 70% positive for NYSE and 73% for NAS. Both basically traded at this level the whole day but slightly off the highs in the morning.
A/D: 1300 for the NYSE and 800 for the NAS. Both A/D lines again trading off the morning highs.
Breadth: approx 70% positive for NYSE and 73% for NAS. Both basically traded at this level the whole day but slightly off the highs in the morning.
SPX front month 10 delta put skew: March 147.1% (21.8/14.82)
SPX front month 10 delta call skew: March 88.6% (11.15/12.58)
SPX Horizontal skew or Front month versus next month: 13.7% (average of March ATM options) versus 14.55% (average of April ATM options).
SPX front month 10 delta call skew: March 88.6% (11.15/12.58)
SPX Horizontal skew or Front month versus next month: 13.7% (average of March ATM options) versus 14.55% (average of April ATM options).
VIX: 16.72
SPY volume: Finished 5% above the 30 day median average.
Quant Predictions
1-3 days: Bearish in terms of pattern and bearish in terms of seasonals
1-4 weeks: Bullish
3-6 months: Bullish
SPY volume: Finished 5% above the 30 day median average.
Quant Predictions
1-3 days: Bearish in terms of pattern and bearish in terms of seasonals
1-4 weeks: Bullish
3-6 months: Bullish
Looking for a short here on yesterday's highs. Gap probabilities at this point look ok with these small gaps. However the best play may still be to fade the gap fill.
Wednesday, February 16, 2011
15th February 2011 - Market Recap
Cumulative ticks: -10,000 which was the lows after bouncing to 5000 during 1.09pm ET
A/D: -600 for the NYSE and -600 for the NAS. Both A/D lines traded in a narrow range but off its lows whereas the NAS finished near its lows.
A/D: -600 for the NYSE and -600 for the NAS. Both A/D lines traded in a narrow range but off its lows whereas the NAS finished near its lows.
Breadth: approx 60% positive for NYSE and 60% for NAS. Both basically traded at this level the whole day.
SPX front month 10 delta put skew: March 148% (21.35/14.34)
SPX front month 10 delta call skew: March 87.1% (10.8/12.4)
SPX Horizontal skew or Front month versus next month: 13.37% (average of March ATM options) versus 14.19% (average of April ATM options)
SPX front month 10 delta call skew: March 87.1% (10.8/12.4)
SPX Horizontal skew or Front month versus next month: 13.37% (average of March ATM options) versus 14.19% (average of April ATM options)
VIX: 16.37
SPY volume: Finished 16% below the 30 day median average.
Quant Predictions
1-3 days: Neutral
1-4 weeks: Bullish
3-6 months: Bullish
SPY volume: Finished 16% below the 30 day median average.
Quant Predictions
1-3 days: Neutral
1-4 weeks: Bullish
3-6 months: Bullish
Once again the dip buyers showed up as the futures sold off in the morning. However the highs and lows were established after that and the futures just traded within that range. It still amazes me how the dip buyers are showing up every time. It seems to be the lay up trade of the last week or so. Anyway we have decent gaps up in the futures this morning but the odds show a mixed bag in terms of probabilities for fading it so I will probably stand aside and watch to see what happens from here. Bonds selling off a bit after the PPI numbers came in pretty high again. I think we are starting to see inflationary pressures build and that would be bad for bonds and could be bad for this market.
Tuesday, February 15, 2011
Market Recap - Monday 14th Feb 2011
Cumulative ticks: +34,000 after trending higher from 11.09am ET
A/D: 250 for the NYSE and 200 for the NAS. Both A/D lines traded in a wide range before narrowing at the end of the day (indecisive market).
Breadth: approx 60% positive for NYSE and 60% for NAS. Both basically traded at this level the whole day.
SPX front month 10 delta put skew: 131% (21.55/16.46) - March 144% (20.97/14.53)
SPX front month 10 delta call skew: 98.7% (11.8/11.95) - March 89.6% (10.67/11.91)
SPX Horizontal skew or Front month versus next month: 14.20% (average of Feb ATM options) versus 13.22% (average of March ATM options).
A/D: 250 for the NYSE and 200 for the NAS. Both A/D lines traded in a wide range before narrowing at the end of the day (indecisive market).
Breadth: approx 60% positive for NYSE and 60% for NAS. Both basically traded at this level the whole day.
SPX front month 10 delta put skew: 131% (21.55/16.46) - March 144% (20.97/14.53)
SPX front month 10 delta call skew: 98.7% (11.8/11.95) - March 89.6% (10.67/11.91)
SPX Horizontal skew or Front month versus next month: 14.20% (average of Feb ATM options) versus 13.22% (average of March ATM options).
VIX: 15.95
SPY volume: Finished 35% below the 30 day median average.
Quant Predictions
1-3 days: Neutral to bearish
1-4 weeks: Bullish
3-6 months: Bullish
More comments later
SPY volume: Finished 35% below the 30 day median average.
Quant Predictions
1-3 days: Neutral to bearish
1-4 weeks: Bullish
3-6 months: Bullish
More comments later
Monday, February 14, 2011
Monday 14th of February - Pre Market Thoughts
All the futures are showing small gaps down apart from the TF. Probabilities for gap fill look good for these small down gaps especially given the overall bullish tone of the market. I will probably look to fade the gap for fill but will wait on the open to see if we can get a bit more selling so that I can get a better entry point. Not much news to speak of this morning so odds are that the market will have a positive bias and fill the gap. Given how overbought the market is, I would say that a 3 point winner in the ES would be worth taking. Anymore than that and you're probably risking it as I expect a bit of consolidation (ie range trading). 1323 would be a good entry methinks to the long side. That's if we can sell off a bit to there.
Sunday, February 13, 2011
Trending day example - Market structure
Friday was a good example of a trending day. I say good because there are better examples (ie 28th of January when we had that nice down day). Here is what the market internals should look like on a trending day. This is a snapshot taken of Friday's market internals eg. breadth (up volume to down volume), A/D lines (advancers versus decliners) and ticks.

As you can see all the internal indicators trended up for the entire day.On a perfect example of a trend day the market internals will almost appear as a straight line as per the yellow trend lines I've drawn in. Another clue that we had a very strong bullish bias was that the bulk of the tick action was squarely above the zero line as captured by the two purple lines I've shown. Also the moving average line as indicated by the blue is also well above 0 indicating the positive bias for the day.
As a side point, (it might be hard to see) but we had an extreme tick reading of 1008 on the NYSE ticks at 11:15 E.T (the times you see are local time to my computer ie Perth) at which point the ES hit at that time a high of 1326.75 on heavy volume and then proceeded to pull back 5 points to 1320.5. This is can be considered a short term tick exhaustion move and John Carter does a good job of writing how extreme tick readings can be faded as a trade setup in his book Mastering the Trade.
Anyway, it's all very easy after the fact to write up an analysis on the day's market structure, the hard thing is to actually determine in real time what kind of market structure is developing before it's known to everyone in the trading universe. However you can get good clues from keeping a tabs on the market internals. Like I always preach, trading is a probability game and it's always pays to keep the probabilities on your side!

As you can see all the internal indicators trended up for the entire day.On a perfect example of a trend day the market internals will almost appear as a straight line as per the yellow trend lines I've drawn in. Another clue that we had a very strong bullish bias was that the bulk of the tick action was squarely above the zero line as captured by the two purple lines I've shown. Also the moving average line as indicated by the blue is also well above 0 indicating the positive bias for the day.
As a side point, (it might be hard to see) but we had an extreme tick reading of 1008 on the NYSE ticks at 11:15 E.T (the times you see are local time to my computer ie Perth) at which point the ES hit at that time a high of 1326.75 on heavy volume and then proceeded to pull back 5 points to 1320.5. This is can be considered a short term tick exhaustion move and John Carter does a good job of writing how extreme tick readings can be faded as a trade setup in his book Mastering the Trade.
Anyway, it's all very easy after the fact to write up an analysis on the day's market structure, the hard thing is to actually determine in real time what kind of market structure is developing before it's known to everyone in the trading universe. However you can get good clues from keeping a tabs on the market internals. Like I always preach, trading is a probability game and it's always pays to keep the probabilities on your side!
11th Feb 2011 - Friday market recap
Cumulative ticks: +17,000 after trending higher the whole day
A/D: 1421 for the NYSE and 882 for the NAS. After starting in negative territory, both trended higher the entire day and finished near the highs.
Breadth: approx 70% positive for NYSE and 60% for NAS. Again both rallied from the lows early in the session (80% & 60% negative) to finish at or near the highs.
SPX front month 10 delta put skew: 156% (19.98/12.8) - March 154% (21/13.63)
SPX front month 10 delta call skew: 88% (11.4/12.97) - March 85% (10.66/12.5)
SPX Horizontal skew or Front month versus next month: 12.89% (average of Feb ATM options) versus 13.06% (average of March ATM options).
VIX: 15.69 (-0.4)SPY volume: Finished 30% below the 30 day median average.
Quant Predictions
1-3 days: Conflicting studies here. Bullish based on seasonality but weakness based on pattern.
1-4 weeks: Bullish
3-6 months: Bullish
Well Friday was a good example of a trending day. The futures gapped lower on the open but that was pretty much the lows of the session as they all trended higher for the remainder of the day. Even though the gaps were fairly large and the probabilities I use for gap fill were low (ie the historical probabilities showed that there was a good chance the down gaps would not fill), the bullish pervasiveness prevailed yet again. Possibly on the Egypt news, consumer confidence or plain old POMO. I was inclined to fade the gap fill again but was away from my trading computer so did not trade at all on Friday. Good thing as I would have been run over. It's interesting to note from the above numbers that the vertical skew in the SPX has steepened from the day before. This is probably from the fact that ATM implieds have come in (moved up the curve) with the VIX falling to 15.69. Term structure or horizontal skew is pretty tight for Feb/Mar and not too bad for Mar/April so time spreads might not be such a bad trade for the income traders. Given that next week is OpEx I will probably start quoting the March options as front month to see what the vertical skew is to see whether normal flys are any good to trade (ie prefer flat skew for normal flys).
On the quant side, all the seasonals point to a strong start to the week followed by weakness on the Thu/Fri before the President's day holiday. So overall I'm inclined to buy any weakness on the Monday/Tuesday and exit perhaps on Wednesday. Market is overbought here so tight stops would be preferred. The bulls do have POMO on their side though and one look at the schedule below from the New York Fed shows that there is an abundance of liquidity been injected into the system for the next 4 weeks. Perhaps this is the source of the pervasive bullishness??
http://www.newyorkfed.org/markets/tot_operation_schedule.html
Looking further out beyond Feb and we do have the Irish elections coming up. It would appear that the opposition are set to take over and they have already mentioned the possibility of renegotiating the bailout agreement with the EU so that senior bondholders will take a hair cut on the debt currently owed. If this comes to fruition then it might set the cat amongst the pigeons. Clearly the Market has not priced this in but will have to do so if and when it becomes a reality (as it always does) (Feb 25th is the date of the elections so keep that in mind). Any pullback or meaningful correction in US equity markets arising from this should be bought if all the longer term quant studies especially from the current tape action are to be believed. Fundamentally money fleeing from Europe will make it's way to US equity markets just to the fact that the US is the strongest in relative terms of all the global economies (with most fund managers believing this to be so). This will continue to be helped with the fact that the US Fed will probably keep to it's loose monetary stance the longest as well (inflation measures are still benign in the US but they are showing up everywhere but - interesting isn't it??). Emerging markets are not faring as well (just look at their charts) and so I expect money to flow back from here to US equities as well. Supporting this is that the dollar seems to have bottomed somewhat and so have UST's. I expect both of these assets to trade sideways to up from here.
Quant Predictions
1-3 days: Conflicting studies here. Bullish based on seasonality but weakness based on pattern.
1-4 weeks: Bullish
3-6 months: Bullish
Well Friday was a good example of a trending day. The futures gapped lower on the open but that was pretty much the lows of the session as they all trended higher for the remainder of the day. Even though the gaps were fairly large and the probabilities I use for gap fill were low (ie the historical probabilities showed that there was a good chance the down gaps would not fill), the bullish pervasiveness prevailed yet again. Possibly on the Egypt news, consumer confidence or plain old POMO. I was inclined to fade the gap fill again but was away from my trading computer so did not trade at all on Friday. Good thing as I would have been run over. It's interesting to note from the above numbers that the vertical skew in the SPX has steepened from the day before. This is probably from the fact that ATM implieds have come in (moved up the curve) with the VIX falling to 15.69. Term structure or horizontal skew is pretty tight for Feb/Mar and not too bad for Mar/April so time spreads might not be such a bad trade for the income traders. Given that next week is OpEx I will probably start quoting the March options as front month to see what the vertical skew is to see whether normal flys are any good to trade (ie prefer flat skew for normal flys).
On the quant side, all the seasonals point to a strong start to the week followed by weakness on the Thu/Fri before the President's day holiday. So overall I'm inclined to buy any weakness on the Monday/Tuesday and exit perhaps on Wednesday. Market is overbought here so tight stops would be preferred. The bulls do have POMO on their side though and one look at the schedule below from the New York Fed shows that there is an abundance of liquidity been injected into the system for the next 4 weeks. Perhaps this is the source of the pervasive bullishness??
http://www.newyorkfed.org/markets/tot_operation_schedule.html
Looking further out beyond Feb and we do have the Irish elections coming up. It would appear that the opposition are set to take over and they have already mentioned the possibility of renegotiating the bailout agreement with the EU so that senior bondholders will take a hair cut on the debt currently owed. If this comes to fruition then it might set the cat amongst the pigeons. Clearly the Market has not priced this in but will have to do so if and when it becomes a reality (as it always does) (Feb 25th is the date of the elections so keep that in mind). Any pullback or meaningful correction in US equity markets arising from this should be bought if all the longer term quant studies especially from the current tape action are to be believed. Fundamentally money fleeing from Europe will make it's way to US equity markets just to the fact that the US is the strongest in relative terms of all the global economies (with most fund managers believing this to be so). This will continue to be helped with the fact that the US Fed will probably keep to it's loose monetary stance the longest as well (inflation measures are still benign in the US but they are showing up everywhere but - interesting isn't it??). Emerging markets are not faring as well (just look at their charts) and so I expect money to flow back from here to US equities as well. Supporting this is that the dollar seems to have bottomed somewhat and so have UST's. I expect both of these assets to trade sideways to up from here.
Thursday, February 10, 2011
Fading today's gap fill
The market opened with large gap downs which according to the probabilities has a low chance of gap fill. Therefore when I saw that the TF had a huge pop off the open but the other indexes weren't showing the same strength, I decided to fade the gap fill on the TF. Went short at 807.4 and covered at 804.7 for a nice 3 point or $300 per contract winner. Once again the dip buyers have showed up and we are now well off the lows (the TF is a full 7 points off the lows - that would have been a nice trade if you caught it). Apparently the catalyst was of the news that Murbarak's resignation is imminent. I don't know what to believe but who cares.......
Cumulative ticks are now positive. I think we will chop it up for the rest of the day here.
Cumulative ticks are now positive. I think we will chop it up for the rest of the day here.
Thursday morning update
From this point forward, I shall endeavour to summarise the main technical indicators that I use every morning. At the end of each trading day I will also summarise these indicators and also my outlook/forecast for the short term (1-3 days), intermediate term (1 - 4 weeks), long term (3-6 months). Doing this will help you as well as me as it will force me to record these values and give me an objective measure of the tape each day.
Time: 10.20am ET
Cumulative ticks: -3,000 and bouncing off the lows of -7,000
A/D: -323 for the NYSE and -71 for the NAS. Both well off the lows of sub 1000
Breadth: approx 60% negative (ie 40% positive) for both exchanges but well off the extreme of 80-90% negative
SPX front month 10 delta put skew: 134%
SPX front month 10 delta call skew: 81.3%
SPX Horizontal skew or Front month versus next month: 12.85% (average of Feb ATM options) versus 13.75% (average of March ATM options).
SPY volume: Currently 60% above the 30 day median average.
Time: 10.20am ET
Cumulative ticks: -3,000 and bouncing off the lows of -7,000
A/D: -323 for the NYSE and -71 for the NAS. Both well off the lows of sub 1000
Breadth: approx 60% negative (ie 40% positive) for both exchanges but well off the extreme of 80-90% negative
SPX front month 10 delta put skew: 134%
SPX front month 10 delta call skew: 81.3%
SPX Horizontal skew or Front month versus next month: 12.85% (average of Feb ATM options) versus 13.75% (average of March ATM options).
SPY volume: Currently 60% above the 30 day median average.
January Trading Recap
With January now past us, it was another successful month of income and spec trading. The ZB iron condor was closed on the 26th of Jan when the put spread was bought back for 0"05 debit. This meant that the second iron condor on the ZB for Feb returned a total of "17 ticks ($265) per contract traded or a ROI of around 28% (on SPAN margining).
On the spec side of things (futures trading), it has been going well but not quite as well as the ZB iron condors. Still struggling with psychological aspects in holding positions for longer than one day (probably due to conflicting analysis that I get). Anyway the combined result of both income and spec trading for the year is that the trading account is up 9.5% which I'm quite pleased about. I will have to work extra hard to maintain this type of consistency for the remainder of the year.
Not many trades on at this stage but I will be looking to leg into yet another ZB iron condor for March expiration (put side). Bonds have been and continue to get crushed with the improving economic data which brings us closer and closer to the day that these super low interest rates around the world will have to rise.
Still holding on to AAPL BWB which now looks like it will expire well out of the money. Overall the market continues to be bought on any dips and most sell offs have largely been contained and limited to one day. At this juncture consolidation is likely and I will be setting up day trades on the e-minis accordingly (I will post more about this later).
Longer term and intermediate quant studies still pointing to odds of higher prices, however in the very short term we will probably get consolidation this week (ie range trading).
On the spec side of things (futures trading), it has been going well but not quite as well as the ZB iron condors. Still struggling with psychological aspects in holding positions for longer than one day (probably due to conflicting analysis that I get). Anyway the combined result of both income and spec trading for the year is that the trading account is up 9.5% which I'm quite pleased about. I will have to work extra hard to maintain this type of consistency for the remainder of the year.
Not many trades on at this stage but I will be looking to leg into yet another ZB iron condor for March expiration (put side). Bonds have been and continue to get crushed with the improving economic data which brings us closer and closer to the day that these super low interest rates around the world will have to rise.
Still holding on to AAPL BWB which now looks like it will expire well out of the money. Overall the market continues to be bought on any dips and most sell offs have largely been contained and limited to one day. At this juncture consolidation is likely and I will be setting up day trades on the e-minis accordingly (I will post more about this later).
Longer term and intermediate quant studies still pointing to odds of higher prices, however in the very short term we will probably get consolidation this week (ie range trading).
Tuesday, January 25, 2011
Trade update
The ZB iron condor is going well. The call side got taken off last week for a debit of "05 debit and the put side is worth around "6 (I have a order to buy it back for "05 as well). At this point in time, although I'm still long term bearish on the long bond, it would appear that bonds are now a proxy for the strength of the US economy and not so much the risk on/ risk off trade that we saw for much of the last 2 years. Thus a strong economy U.S relative to other countries is driving demand for the bonds and other U.S. assets whilst weakness sees selling. Relative to other economies the US looks the strongest which is why you are also seeing the USD holding firm.
The AAPL is also doing ok with the trade up around 6%. Here is the snapshot of the trade as it stands.

Overall I will hold onto this trade as I'm thinking any pullback in the general market in Feb will be good for this trade.
The AAPL is also doing ok with the trade up around 6%. Here is the snapshot of the trade as it stands.

Overall I will hold onto this trade as I'm thinking any pullback in the general market in Feb will be good for this trade.
Tuesday morning pre-market thoughts
Quant studies imply strength heading into the end of Jan, that combined with the bullish bias leading up to the FOMC announcement combined with the good odds of gap fill today even with these relatively large gaps, has me a buyer on any weakness off the open. I've got an order to go long on the ES at 1281.25. In the intermediate term, some quant studies are leaning towards Feb weakness so perhaps selling some out of the money call spreads on the RUT or the SPX is not such a bad idea also.
Wednesday, January 19, 2011
If I didn't think the market was going up then why didn't I go short today??
I still struggle with this one. Methinks I will need to do some deliberate practice on a paper trade account to get accustomed to switching sides when the market tells me to like all great traders.
Modern Market Misconceptions
I was doing some thinking over the weekend after reading a few forum and blog posts and here are some thoughts stemming from that.
- Markets are not always efficient. In fact I would posit that they never were/are.
- Markets are not free. (Especially these days with so much central bank intervention).
- From point (1), the market will never price something in unless it has to. This is because the market is made up of people and people are not rational all of the time.
- From point (3). Therefore one only needs to be one step ahead of the market to profit, and not 30 steps as you will be waiting a long time to get paid. (This is the reason why I don't listen to all the doom-sayers and perma-bears because I know while they may be right eventually that doesn't mean the market will price in all these things until it has to. Think subprime ie it was known well before the crash of 2008 but yet the market kept going up).
- Traders should stop thinking of cheap or expensive but in terms of if I buy here, can I sell it for more later or if I sell here, can I buy it back for cheaper.
Anyway I will probably have more thoughts but at least I've got these ones on paper.
Heads up....
Internals are weak and getting weaker. Risk assets are selling off like the AUD, EURO, and Oil while the USD is up as well as bonds. Cumulative ticks have trended straight down (@-5000 after 25mins) and other internals are pretty weak. Could this be the first 1% down day for a long time?? Geez...that would be something!!
Condor Ping Pong
It's been a while since I last posted but in that time, I've been playing the iron condor ping pong on the ZB again. I sold some call spreads when the ZB was at 122 and then sold some put spreads when the ZB was at 120. My trade currently looks like this.

The trade is up a decent amount even only after 5 days. Again I'm long term bearish on bonds so any chance they pop up I will go short deltas. The reason why I'm also adding the put side at this juncture is because I do believe that the equity markets will correct soon which will encourage the risk off trade (ie money moving to UST's) and that bond yields will remain attractive to buyers with the bonds at lower levels (bond prices and yields move inversely). The latest TIC long term purchases data showed that foreigners bought 85.1 billion of long term treasuries which was a large increase from the previous month which seems to support this theory.
Apart from this trade, I managed to get into a AAPL earnings BWB yesterday at the open. I bought the 325/315/295 Feb Put BWB for $0.20 credit. The plan on this trade is just to hold and see if markets do correct then it might be worth something at expiration. If not I will keep the credit on this trade.

The last trade I did was I went short the ES at an average of 1295 yesterday. I covered all of the position at 1292.5 before the market opened based on my gap guide subscription that showed that fading down gaps on Opex Wednesday was historically a very good trade. Thus my plan was to cover the position and then fade today's gap. Unfortunately I'm already out of that trade having went long at the open on the ES at 1290 and then moving my stop because the early morning market tape action was not all that positive. Therefore I moved my stop and covered at 1288.50 taking a small loss (as I type this I can see internals are getting weaker and so is the price action which vindicates my decision to cut into my trading plan and take the small loss rather than waiting for the market to hit it).
Overall quant studies are showing weakness this week and it's interesting to note that if the markets have not had 9 positive consecutive weeks since the 2009 bottom as Bill Luby of Vix and More blog points out. If markets finish positive this week, that will be the 8th positive week so some caution for longs is warranted.

The trade is up a decent amount even only after 5 days. Again I'm long term bearish on bonds so any chance they pop up I will go short deltas. The reason why I'm also adding the put side at this juncture is because I do believe that the equity markets will correct soon which will encourage the risk off trade (ie money moving to UST's) and that bond yields will remain attractive to buyers with the bonds at lower levels (bond prices and yields move inversely). The latest TIC long term purchases data showed that foreigners bought 85.1 billion of long term treasuries which was a large increase from the previous month which seems to support this theory.
Apart from this trade, I managed to get into a AAPL earnings BWB yesterday at the open. I bought the 325/315/295 Feb Put BWB for $0.20 credit. The plan on this trade is just to hold and see if markets do correct then it might be worth something at expiration. If not I will keep the credit on this trade.
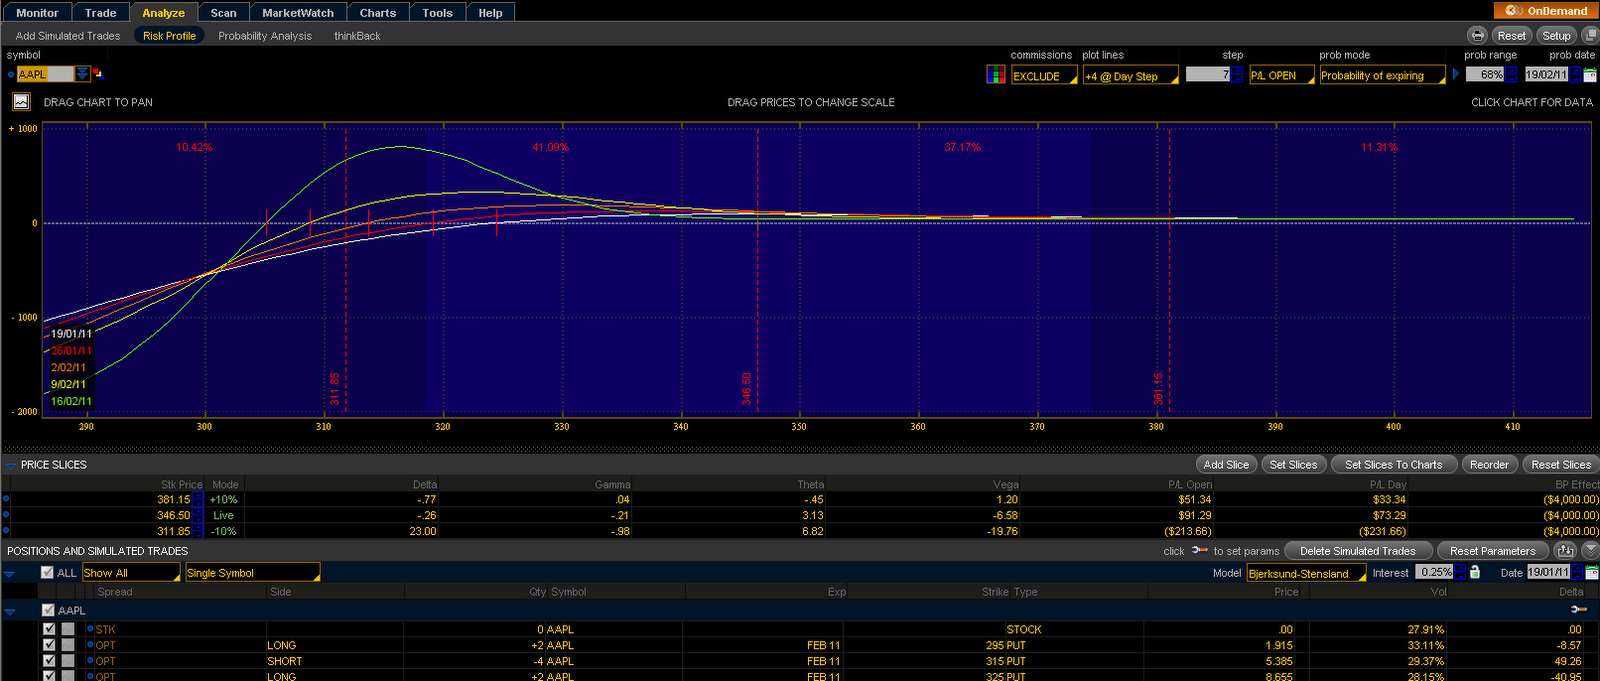
The last trade I did was I went short the ES at an average of 1295 yesterday. I covered all of the position at 1292.5 before the market opened based on my gap guide subscription that showed that fading down gaps on Opex Wednesday was historically a very good trade. Thus my plan was to cover the position and then fade today's gap. Unfortunately I'm already out of that trade having went long at the open on the ES at 1290 and then moving my stop because the early morning market tape action was not all that positive. Therefore I moved my stop and covered at 1288.50 taking a small loss (as I type this I can see internals are getting weaker and so is the price action which vindicates my decision to cut into my trading plan and take the small loss rather than waiting for the market to hit it).
Overall quant studies are showing weakness this week and it's interesting to note that if the markets have not had 9 positive consecutive weeks since the 2009 bottom as Bill Luby of Vix and More blog points out. If markets finish positive this week, that will be the 8th positive week so some caution for longs is warranted.
Thursday, January 13, 2011
Thursday morning thoughts
Interesting that cumulative ticks finished at -50,000 on yesterdays session in contrast to the other internals which finished up. As I look around today, I see that all risk assets are solidly up. Possibly the small down gap in the futures looks like a good fade, particularly after we've had 2 days in a row where it hasn't filled (higher probability of filling when this occurs).
Wednesday, January 12, 2011
Trade update and Wednesday thoughts
I am totally flat again. I did not go long the ES at 1268.25 because with the early morning tick action I decided to be conservative and target a fill around the pivot area which was closer to 1263.75. My condor trade on the ZB has also been closed out. The put spread was closed for a "5 debit and the call spread was bought back for "6 debit. This yielded a total of 8 x 4 + 10 x 6 ticks for a total of 92 ticks with each tick worth $15.625 giving a total return of $1437.50 on span margin of $4000. This is a 36% return in about 9 days (when I first opened the short call spread side). Overall a very good trade and it puts the account up about 5.5% for the calendar year. At this rate I will be quitting my day job very soon! (joking). Jokes aside, I think the pledge by the various governments to support the Euro area as being very positive. Still the markets are in my opinion overbought and there remains a good dose of cautiousness on the behalf of most investors. Earnings season has started so it will be interesting to see what the reaction will be. I think we may be seeing a return to more normalized market conditions ie term structure flattening and realized volatility begin to shrink from the craziness of previous years. It's clear that all governments are enticing or forcing people to get into the leveraged risk taking behaviour of previous bull markets. Will it end badly?? Of course it will. It always does. However, it will be a while before that happens so as long as the general conditions are favourable for risk taking then ride for all you can. That means buying the dips, corrections etc etc. Not a bad idea to set up bullish collars for most of your long trades (ie go long underlying but buy an out of the money put and sell a call when the market seems heavy ie like now).
Today's action might be a repeat of yesterdays. The locals are short and will try to fill this gap but the market is holding up well. Cumulative ticks are trending down at the moment but the risk assets across the board although off the premarket highs are holding up well. I may have another shot at a long here on the ES at around 1271. I have a feeling that the locals will once again try to push lower and trigger the sell stops before afternoon buyers buy the market once again. I'm conservative with my fills because I don't have the luxury of staying up the whole day to watch the market as being down under I need my sleep. I'm mindful of the big flush move that you can get once the downside momentum starts and I don't want to get stopped out.
Today's action might be a repeat of yesterdays. The locals are short and will try to fill this gap but the market is holding up well. Cumulative ticks are trending down at the moment but the risk assets across the board although off the premarket highs are holding up well. I may have another shot at a long here on the ES at around 1271. I have a feeling that the locals will once again try to push lower and trigger the sell stops before afternoon buyers buy the market once again. I'm conservative with my fills because I don't have the luxury of staying up the whole day to watch the market as being down under I need my sleep. I'm mindful of the big flush move that you can get once the downside momentum starts and I don't want to get stopped out.
Tuesday, January 11, 2011
Hmmm
Seems to be a reversal of risk after the open today. USD is up, Euro is down along with gold and the AUD right after the open. Could be some people booking profits. Cumulative ticks are also down. Perhaps we could see some afternoon buyers stepping in again. I'm looking to go long ES at 1268.25.
Tuesday morning thoughts
The market rallied off the morning gap down and never looked back. Cumulative ticks although sharply negative in the first 15 mins bottomed at -10,000 and trended higher the rest of the day to finish at +40,000. All other internals managed to turn around the bad start as well and finish positive apart from NYSE breadth and A/D lines which finished flat. Small caps and tech did better than the majors so that is a positive sign for risk and the markets overall. Quant studies are showing a bullish to flat bias here and with the current relatively large gap in the ES and other futures, the odds favour a gap and go (or at least a no gap fill situation) which means that the market should finish positive for today. More importantly however is the news that China and Japan will support the purchase of European sovereign bonds. That is a positive for the PIIGS s there is a lot of new issuance out this week. Overall this has calmed the markets somewhat and I will expect another retest of the the last swing highs before the week is out.
Friday, January 7, 2011
Inverted Chinese yield curve
Did a bit of sleuthing after reading an article on Bloomberg about Chinese corporate bond yields and it seems that the inverted yield curve shows up in the Chinese government bond market as well. Given the well documented relationship between inverted yield curves and their predictive powers to forecast recessions, does this mean that a Chinese recession is looming??

Tip - use this link here to find the symbology on Bloomberg (you can get all the same tickers as used in the professional service ie upwards of $10,000 a year Bloomberg terminals). You will need to do a bit of homework to get the ticker to work though ie Indexes have the :IND after the ticker for example:
CHBIGB1Y:IND is the symbol for the 1 year bond
Chart is courtesy of Bloomberg.
Tip - use this link here to find the symbology on Bloomberg (you can get all the same tickers as used in the professional service ie upwards of $10,000 a year Bloomberg terminals). You will need to do a bit of homework to get the ticker to work though ie Indexes have the :IND after the ticker for example:
CHBIGB1Y:IND is the symbol for the 1 year bond
Chart is courtesy of Bloomberg.
Here's a free tip
If you are like me and like to be in the know on all things going on in the financial world then you can't ignore the free market commentary and intraday alerts from the happenings of the credit markets especially in Europe. The best tool for this is to subscribe to a RSS feed from Markit here. Use a reader like google reader and you won't miss the important financial news from the credit markets each day. Remember what happens in the credit markets almost always lead the equity markets. Notable story of late is that there is quite a consternation in Europe still with the news that senior bank bondholders may have to take haircuts on any sovereign debt restructure. Some bank credits are now trading at record wides. Check out the latest alert here.
Thursday, January 6, 2011
Worth another shot??
Still seeing weakness here on the ticks (trending lower and @-7000) so another short right here at ES @ 1273 might be worth a shot.........................still you can't discount the bulls can you?? Oh we do have lots of POMO this week too!
Short TF @ 794.50
I went short on the TF @ 794.50 premarket and I have just covered at 791.60 for 2.90 points. Not a bad trade yet I couldn't stomach holding the short position yet again as my target would be 788 which would be where the pivot is. I think I have a case of bullphobia which can only be described as a psychological disease that causes me to cover short positions at the first sign of a bullish candle on a 1600 tick chart whenever I trade the e-minis!! I think it's a case of having bad experiences from 2009 when I completely misjudged the market and got run over because I was too bearish. In any case I feel more comfortable trading this market from the long side (it is the easiest side to trade of course - going with the trend) so until I work on it then I know I won't be a complete trader.
Self destruction Tuesday!
Yes I shot myself in the foot on Tuesday when I shorted the ES at 1269.25 and let my fear overcome my plan as I bailed at 1268.00 for a 1.25 pt winner and not the 4-5 point target I had planned. Why did this happen? How did I let my fear ruin a perfectly good trade setup and plan? Well for one, sitting in front of the screen and watching every single tick movement go by has in the past not helped me as it has put doubts into my day trades. This also goes for listening to Trader's Audio on the TOS platform and hearing that there was some "paper" buying around. Secondly I was taking a counter trend trade and the thoughts of the bulls stepping in on weakness and ripping the bears a new one was at the forefront on my mind even though market internals started out weak and weren't bouncing. Early on I was watching the price action movement and there seemed to be some buying by bulls on the early weakness. However, once the "locals" were able to push lower, stops were hit and people started to bail which took the market lower. Alas it all came too late as I was already out within the first 20 mins of trading. One of those times where I should have set and forget on the trade and just let my plan make all the decisions as I have a loss and profit stop set up on all these futures trades.
Well enough of the self critical analysis. As a recap, market internals still finished +10,000 on Tuesday whilst the other indicators finished mildly weaker. As for yesterday's session, cumulative ticks finished at +27,000 and other internals finished quite positive. On the quant front though, studies are now pointing to some short term weakness so taking another stab at a short here with the ES at 1271 is not a bad idea from a risk to reward point of view. Volatility has certainly picked up across a whole range of asset classes and that is the first sign that we might get a correction of some sort here. Other good measures of risk assets like the AUD/USD have also come well off it's highs so that might be another red flag.
On the trade front I have condored my ZB short call spread somewhat, by selling 4 x of the 113/110 Feb Put spreads for "13. I say somewhat because I am short 6 of the 128/131 call spreads which have now trading around 9". I have a nice little profit on this trade and so by selling the put spreads I have locked some of it in the short term if we do get some sort of rally here in treasuries if the risk off trade does come to fruition.
Well enough of the self critical analysis. As a recap, market internals still finished +10,000 on Tuesday whilst the other indicators finished mildly weaker. As for yesterday's session, cumulative ticks finished at +27,000 and other internals finished quite positive. On the quant front though, studies are now pointing to some short term weakness so taking another stab at a short here with the ES at 1271 is not a bad idea from a risk to reward point of view. Volatility has certainly picked up across a whole range of asset classes and that is the first sign that we might get a correction of some sort here. Other good measures of risk assets like the AUD/USD have also come well off it's highs so that might be another red flag.
On the trade front I have condored my ZB short call spread somewhat, by selling 4 x of the 113/110 Feb Put spreads for "13. I say somewhat because I am short 6 of the 128/131 call spreads which have now trading around 9". I have a nice little profit on this trade and so by selling the put spreads I have locked some of it in the short term if we do get some sort of rally here in treasuries if the risk off trade does come to fruition.
Tuesday, January 4, 2011
Tuesday morning notes
Futures are all up slightly this morning and the odds are good for a gap fade (gap fill). Some of the quant studies that appeared suggest some consolidation and possible weakness in a couple of weeks. I may look at taking a short on the ES at around 1270 and hold for a 4-5 point profit target.
Market internals as you would expect yesterday all finished squarely positive. Cumulative ticks finished at +50,000 while breadth and A/D lines were also very strong. I'm also looking to play some condor ping pong with my short call spread on the ZB. At this stage I'm looking to condor it off by selling some put spreads as I think there will be some support coming in and if we do see some equity weakness in the next couple of weeks then that should keep treasuries afloat (risk off trade).
Monday, January 3, 2011
Trade update
It's looking very much like a gap and go situation here. All the futures are up around 0.7% so don't be surprised if this turns out to be a nice trending day for the bulls. Personally I would be a buyer at 1260 on the ES here which corresponds to the R1 persons pivot. Earlier today I also sold the 128/131 Feb call spread on the ZB for 16" credit. Again, I'm looking to take this off for around 6" debit with the adjustment point at around 125. A nice little move since I put the trade on has me up nicely on the trade today.
The only thing to fear is fear itself!!
Well I'm using that title for today's post because it would appear that the only thing standing in the way of traders this week is the psychological aspect that the bullish sentiment is overdone and we are due for some sort of correction. In the quant space I'm seeing OVERWHELMING evidence that this first week will close POSITIVE and that the REST OF THE YEAR will be a another DOUBLE DIGIT GAIN for the US equity markets (I thought I'd use caps just to emphasize those points). Right now we see quite large gaps in the futures which from a statistical and seasonality standpoint will favour a gap and go type (no gap fill) situation if we are still around here at the open (1260 on the ES) of the cash session. The highest probability trade I see is to buy ANY weakness (and I mean any weakness) today and hold long for the rest of the week. Lots of POMO activity this week which should be supportive of the markets and also I predict improving fundamentals in terms of the data coming out too.
Thursday, December 30, 2010
Heads up for Thursday's session
Big divergence between price, breadth, A/D lines and the ticks. Whilst the first 3 all finished positive, ticks trended down the whole session with cumulative ticks finishing at -50,000. Definitely shows that the bids were getting hit more than the ask. Perhaps a sign that some of the smart money is locking in their gains for the year or taking some profits at this point? The futures are trading in a tight range right now so it will be interesting to see where price breaks to in the new year.
Wednesday, December 29, 2010
Totally flat!
I have no positions on at the moment. I covered my ES long at 1252.50 on Monday's afternoon session as I wasn't feeling all that bullish after the pre-market sell off on the weekend on the news China had raised its interest rates. A bit of emotions probably got to me especially after I had held my long as the ES got to a low of 1245. I was also away from my trading computer and did not see that cumulative ticks trended up the entire day to finish at +70,000 or else I would have moved my profit stop at 1256 (retest of the highs).
My profit stop on the short 125/128 call spread on the long bond was hit yesterday as treasuries tanked (they've been pretty volatile of late). I sold it for 16 and bought it back for 6 so that makes 10 ticks on $15.625 per tick per contract. That's a pretty good trade considering an ROI of 18% ($625/$3400) on a 8 day trade.
FYI, quant studies still point to more bullish action ahead but sentiment is nearing bullish extremes which I don't really feel comfortable with. Under the hood, the tape action has been strong all week with another +30,000 finish last session on the ticks. Volume as you would expect is extremely light so I'm not sure you can look into it too much. I do see the VIX has bottomed and small caps and tech have slightly underperformed the last 2 days so perhaps that is good reason to wait things out and see where this market wants to go. Remember volatility has typically picked up early in Jan so that might be good reason for those that have sold some option premium to start taking some profits.
Enjoy the rest of the holiday folks and have a great new year if I don't post again.
My profit stop on the short 125/128 call spread on the long bond was hit yesterday as treasuries tanked (they've been pretty volatile of late). I sold it for 16 and bought it back for 6 so that makes 10 ticks on $15.625 per tick per contract. That's a pretty good trade considering an ROI of 18% ($625/$3400) on a 8 day trade.
FYI, quant studies still point to more bullish action ahead but sentiment is nearing bullish extremes which I don't really feel comfortable with. Under the hood, the tape action has been strong all week with another +30,000 finish last session on the ticks. Volume as you would expect is extremely light so I'm not sure you can look into it too much. I do see the VIX has bottomed and small caps and tech have slightly underperformed the last 2 days so perhaps that is good reason to wait things out and see where this market wants to go. Remember volatility has typically picked up early in Jan so that might be good reason for those that have sold some option premium to start taking some profits.
Enjoy the rest of the holiday folks and have a great new year if I don't post again.
Friday, December 24, 2010
Using the pivots to setup my trades
As promised here are some screenshots (TOS platform) of my entries for my futures trades yesterday.
 As you can see I like to view all 4 different time frames with this tool and I also have the Persons Proprietary indicator on (the yellow and blue arrows). I use a weekly time frame pivot for the daily chart and a daily time frame for the other 3 (hourly, 15min and 5min). This wasn't a perfect entry as the low of the day was 1249.25 but it's good enough as the ES found support and rallied off it. If you had use the regular floor trader pivots (see screen shot below), you may have gotten a better entry as the ES bounced off that support perfectly.

The last screen shot shows the TF and you can see how I missed the entry because I placed my order at S2 and not at S1 (was more conservative as the TF moves more and is more highly leveraged).


The last screen shot shows the TF and you can see how I missed the entry because I placed my order at S2 and not at S1 (was more conservative as the TF moves more and is more highly leveraged).

Patience pays off!
I am long ES at 1250. All day I had 2 orders in, one on the ES and one on the TF (@784.30). I got these price levels by using Person's (of John Person fame) pivots which is my favourite type of pivot to use. So now I will probably set a tight stop and sit tight with this trade and let the seasonal factors take me through to the New Year. I hoping for a monster first couple of trading days in January (historically realized vols on the first 2 days is almost double the average trading day realised vol - last year was no exception and it was to the upside). A repeat of that performance from last year and I will be looking to close. Either way I will sit tight. I was a bit more conservative with the TF trade on the entry and that was why I set the entry price at S2 instead of S1 like I did with the ES. Reasons are that the TF is more leveraged than the ES (1 point move on 1 contract equals $100 whereas the ES is $50). Both futures bounced off the pivots perfectly which is why I use pivots to trade the futures. (I will post screenshots later).
January 2011 thoughts
I see continued quantitative evidence for the rally to continue in the intermediate term. However, the further we rally the higher the probabilities of a correction before we continue to go higher. This will be my prediction going forward. We may get further upside early January but I'd be looking for some sort of correction (catalyst unknown but I'm thinking Europe sovereign or China rate concerns) before we set off again. I'm absolutely positive that any sell off will present another buying opportunity just based on how strong the tape readings have been. I can't see a change in the overall nature of the market from a bull to a bear (this normally takes time anyways as all the research shows that markets don't suddenly reverse from a bull to a bear but tops take time to form). We still have ultra low interest rates in the advanced economies (ie a very steep yield curve), accommodative government and central bank policies, equities are still cheap relative to bonds, economic data improving and the market is trending up (so you have to give it the benefit of the doubt).
I just wish at this point that we actually get a nice down day so I can get long again!
I just wish at this point that we actually get a nice down day so I can get long again!
Wednesday, December 22, 2010
Oops I lied
Forgot I had a short Jan 125/128 call spread order working on the 30 year UST or the ZB. I just got filled at "16 credit. I am very bearish on treasuries in the longer term and bonds in general because of:
1) Higher risk premiums to hold debt due to sovereign concerns, municipality concerns etc etc
2) Excessive money printing by the Fed ie feeding inflation fears as economic data improves
3) Money rotating out of bonds and into equities which are still cheap in comparison
I am looking to be a seller of every UST rally going forward but will swing trade it over the longer term timeframe. ie I will be looking to cover my short call spreads when we hit levels where I think price will bottom temporarily. For this trade that will be at 119'10.
The only thing I fear for this trade is the "flight to safety" trade if we get some repeat of the flash crash and everyone runs to buy the safest and most liquid assets out there which is still USTs but even that will diminish over time as the US deficit grows and it's credit rating may subjected to a downgraded.
1) Higher risk premiums to hold debt due to sovereign concerns, municipality concerns etc etc
2) Excessive money printing by the Fed ie feeding inflation fears as economic data improves
3) Money rotating out of bonds and into equities which are still cheap in comparison
I am looking to be a seller of every UST rally going forward but will swing trade it over the longer term timeframe. ie I will be looking to cover my short call spreads when we hit levels where I think price will bottom temporarily. For this trade that will be at 119'10.
The only thing I fear for this trade is the "flight to safety" trade if we get some repeat of the flash crash and everyone runs to buy the safest and most liquid assets out there which is still USTs but even that will diminish over time as the US deficit grows and it's credit rating may subjected to a downgraded.
Tuesday morning update
It's a real chop fest out there today and odds are we are probably going to stay that way. Ticks are now trending sideways and so are other intenals. Great market if you've sold some premium, otherwise you are better off playing online poker or something if you want some action. It's times like this where you have to stay disciplined and not force a trade. Seasonals and other stats still favour end of year strength but the market is now quite overbought. Perhaps it's the POMO effect kicking in??
Tuesday, December 21, 2010
Monday wrap up
I got long yesterday on the TF at 777.1 as the market was showing some slight weakness. Unfortunately I couldn't stomach holding the trade as ticks were still trending negative at 10.30am so I exited at 778.3 for $120 per contract. No real edge in trading here today as the market holds the early morning gap. Ticks are trending lower though and other internals have come off the highs. Still any weakness is likely to be bought as that remains the layup trade for the last week so any short would basically be a 2-3 point trade with a great entry close to the high of the day. No real option trades either on the indexes as most of the holiday premium has been priced out.
Friday, December 17, 2010
Thursday session recap
All market internal indicators finished positive yesterday. A/D lines closed at close to 1000 on both the NYSE and Naz while breadth finished close to 70% positive for both exchanges. Cumulative ticks also finished positive at around 25,000 which is something it hasn't done for a while. Actually the divergence between the early morning tick action which started to turn before the price on the indexes, lead me to take a long trade on the TF (Russell 2000 e-mini futures). I chose the TF because Rob Hanna from quantifiable edges (of which I'm a subscriber) research has shown that the Russell shows a high level of bullishness at this time of the year relative to the other majors. Whatever the case, I got long at 768.9 and closed out at 773.7 for a nice gain of $480 per contract. It would have been more but such is one of my bad habits and character weaknesses in trading these highly leverage instruments I have not been able to control my fear/greed and moved my profit stop down from 775 so that I could go to sleep with the a profit in the bag. As always one should master the discipline that comes from trading the plan.
This morning when I woke up, I saw the news that MA and V had both lost 10% because of proposed legislation to cut credit card fees. I thought that this might be an opportunity to throw on my favourite BWB trades which are contrarian in nature and benefit from selling high skew. Alas when I went to check if I could construct any trades for Jan expiration I found that I couldn't which means that skew is low implying that this sell off is perhaps a once off and the market is not expecting much further downside. Perhaps a calendar might be worth investigating especially for those that understand the concept of weighted vega (see my mentor Mark Sebastian's many informative posts about this over at Option Pit).
Anyway the outlook for Option Ex today is bullish according to seasonal factors and other statistical factors. Note that strength on OpEx Friday may also induce weakness on the Monday as well. If you like to know what the probabilities are and are into this quant type of information then it pays to subscribe to Wayne Whaley's emails by emailing wayne@witterlester.com with subject ‘Add to Daily Email’, or vice versa for deletions.
My own feelings is that this market still looks a bit heavy and if it were not for all the bullish factors in play we would probably have already come back down and tested the 20 day moving average at 1214 on the ES. So I'm still hesistant to hold longs for longer than a day. Bonds continue to come under pressure as more stimulus and improving economic numbers as well as other factors lead the market to pricing in higher interest rates. A good blog on that by Surly trader is posted here. Again this is a natural part of the fundamental structural shift in the market where the market is no longer pricing in recovery but growth. In my opinion, I believe the equity bear won't be coming back until we start to see an inverted yield curve and that will only happen when the Fed begins to raise rates. Expect that to happen end of 2011 or early 2012, till then it's higher we go with the occasional 10% correction thrown in.
Posting will probably be light heading into Christmas and the New Year so with that I would like to wish all of you a Christmas filled with lots of love, laughter and food and a happy and prosperous new year!
This morning when I woke up, I saw the news that MA and V had both lost 10% because of proposed legislation to cut credit card fees. I thought that this might be an opportunity to throw on my favourite BWB trades which are contrarian in nature and benefit from selling high skew. Alas when I went to check if I could construct any trades for Jan expiration I found that I couldn't which means that skew is low implying that this sell off is perhaps a once off and the market is not expecting much further downside. Perhaps a calendar might be worth investigating especially for those that understand the concept of weighted vega (see my mentor Mark Sebastian's many informative posts about this over at Option Pit).
Anyway the outlook for Option Ex today is bullish according to seasonal factors and other statistical factors. Note that strength on OpEx Friday may also induce weakness on the Monday as well. If you like to know what the probabilities are and are into this quant type of information then it pays to subscribe to Wayne Whaley's emails by emailing wayne@witterlester.com with subject ‘Add to Daily Email’, or vice versa for deletions.
My own feelings is that this market still looks a bit heavy and if it were not for all the bullish factors in play we would probably have already come back down and tested the 20 day moving average at 1214 on the ES. So I'm still hesistant to hold longs for longer than a day. Bonds continue to come under pressure as more stimulus and improving economic numbers as well as other factors lead the market to pricing in higher interest rates. A good blog on that by Surly trader is posted here. Again this is a natural part of the fundamental structural shift in the market where the market is no longer pricing in recovery but growth. In my opinion, I believe the equity bear won't be coming back until we start to see an inverted yield curve and that will only happen when the Fed begins to raise rates. Expect that to happen end of 2011 or early 2012, till then it's higher we go with the occasional 10% correction thrown in.
Posting will probably be light heading into Christmas and the New Year so with that I would like to wish all of you a Christmas filled with lots of love, laughter and food and a happy and prosperous new year!
Wednesday, December 15, 2010
Different day but same divergences
Well another remarkable day in that market internals all finished in the red with negative breadth and A/D lines and cumulative ticks finishing in at -40,000 but price actually finished positive on the day. Go figure. This is a very rare set of circumstances indeed. On another front bonds are getting smashed and yields are rising very quickly. Again it would appear that we are about to enter a new phase in the markets. I still think we will go higher from here but the fundamentals are definitely shifting. This may be the last leg up in this bull market before the bear returns.
Tuesday, December 14, 2010
Rally is running on fumes!
Well another day and another massive divergence between NYSE tick action and price. Whilst we managed a pretty flat session, under the hood cumulative ticks finished at a whopping -120,000. Quite a rare setup in historical terms. CBOE put to call ratios continue to come in extremely low (sub 0.50) which has bearish implications looking out a couple of months. The feeling I get is that when this abnormal resiliency of the market ends, get ready for a very sharp and quick move down. In fact I wouldn't be surprised if we get some sort of a contrived down day (ie sell off 3% on really heavy volume and breadth) soon. I bet you all the retail traders are long right now and we are right at the 61.8% fibbo retracement level on the weekly charts from the 2007 highs so expect some resistance here.
Monday, December 13, 2010
Monday morning update
Internals are flat but quite a divergence with the ticks as it is trending negatively. Historically Dec Op Ex week is one of the strongest of the year. It would appear that all of the seasonal tendencies are playing out. I wonder what happens when the smart money starts taking money off in the New Year. Anyway from the tape action, it's clear that this market will just not go down. Blame it on the Fed's POMO but whatever it is, it just isn't providing a good opportunity to get long again as I'm still waiting for a half decent dip.
Thursday, December 9, 2010
Morning update
Cumulative ticks are trending solidly negative right now. Other internals are all weakening suggesting lower prices. Probably will be a range trading day today. I'm not expecting a breakout but you never know. With end of year window dressing I still think this market will be bought at lower levels. Volatility is coming in a bit too. Exited the ES trade earlier today at 1235 for 15 point winner. (Now if only everyday was like that!!). Still holding onto the GOOG and OEX trade.
Trade update & quick recap
I went long on the ESZ0 at 1220 yesterday. I have a trailing stop on this at 1228 and am going to ride this for as long as I can (It's at 1233.50 right now). This trade is made because as explained in my previous post, the stats all point to higher prices next week and I do expect some sort of Xmas rally. What's concerning though is that the last session showed a large amount of divergence. Cumulative ticks finished at -50,000 which is quite bearish and A/D lines were -600 on the NYSE and flat on the Nasdaq. Breadth was the only thing that was positive but even that was quite weak on the NYSE especially. What this tells me is that the rally is narrowing greatly. The only plausible explanation is that all the money right now is flowing into the heavily weighted large cap names which is why the A/D lines can finish negative but the major indexes still finished positive last night with the exception of the RUT (small cap index) which only confirms my hunch. This would also explain the cumulative tick behavior of late. I would be surprised if we had a major sell off so close to Christmas and with the Fed's POMO operation in full swing but you never know......
The OEX BWB trade has made all the money that it can ($0.60 credit), whilst GOOG has rebounded nicely to 590. The original BWB is now trading for around a credit of ($0.40) to take off as the options expire next week. I may think of doing an adjustment soon. Perhaps something like a "Reverse Harvey" (buying back the cheap short put spread) to lock in the profit and reduce risk.
The OEX BWB trade has made all the money that it can ($0.60 credit), whilst GOOG has rebounded nicely to 590. The original BWB is now trading for around a credit of ($0.40) to take off as the options expire next week. I may think of doing an adjustment soon. Perhaps something like a "Reverse Harvey" (buying back the cheap short put spread) to lock in the profit and reduce risk.
Wednesday, December 8, 2010
End of year thoughts
Well the market has made a nice move higher since my last post which was not that long ago. What a difference a week makes hey? We managed to get above 1200 and then moved very quickly back to the old swing highs where we now roughly sit. Whilst the ECB did not announce any new measures they did hint that they would do what was necessary and showed this to the market by buying Irish and Portuguese bonds through their Securities Market Program on the day of the announcement. However, the European sovereign debt saga is definitely not over (will it ever be??) and personally I would expect future shocks to come as there is still no agreement on how to deal with the situation. At the end of the day some form of restructuring is going to have to take place. Expect in the interim for the ECB to start expanding it's bond buying program in the meantime. If and when Axel Weber gets in then that could all change. In other news the U.S. unemployment rate ticked up to 9.8% but this news was offset by a big spike in pending home sales. Overall the data coming out of the U.S. is improving but unemployment is not which is going to give the Fed another mandate to add even more liquidity to the system with QE3 probably sometime in the middle of next year.
As for predictions going forward, most of the historical data and statistics suggest high probabilities for further intermediate term strength (which is where I'm leaning). Seasonally we get the usual Xmas rally around this time of the year and I expect nothing different to happen this year (most traders will be on holidays so expect any big moves to come in the new year). I can see the SPX moving towards the next target of 1300 early in the new year. However in saying that there are signs that of divergences building up with internal market indicators. This last upswing since the November highs has occurred with narrowing breadth, decreasing volume, lesser number of net highs and lower cumulative ticks. All course this could all change but you would have to remain cautious without this confirmation of the current price action. Indeed this type of a divergence was prevalent towards the latter part of 2007 and culminated with the massive bear market the following year so one needs to be careful. We have had a large amount of market intervention by the Fed (POMO for instance) and other central banks and this could be what's holding the market up.
I suspect that major structural flaws in the financial system (that of over indebtedness) will only become a huge problem when all the quick fixes and solutions don't appear to work anymore. Right now we are seeing bonds selling off across the board (especially in sovereigns) and longer term interest rates rising. This will become a limiting factor as to how much more easing the central banks can do. For 2011, inflation and rising bond yields will become the big theme. Whilst right now this isn't so much of a concern as it suggests an improving global economy, it could ultimately prove to be a negative on stocks especially if unemployment remains high and we get some kind of sharp spike caused by sovereign default for example. The Chinese inflation story is also a worry as the path that they are on is clearly not sustainable. Of course I expect the stock market to discount these fundamental problems and overvalue itself just as it did with the U.S. housing market back when problems first surfaced in 2006. This is because I believe markets and their behavior are largely built on riding the trend for as long as possible, herd behavior and short-term-ism approach (especially true in today's high frequency, algorithm and robot dominated trading).
As for predictions going forward, most of the historical data and statistics suggest high probabilities for further intermediate term strength (which is where I'm leaning). Seasonally we get the usual Xmas rally around this time of the year and I expect nothing different to happen this year (most traders will be on holidays so expect any big moves to come in the new year). I can see the SPX moving towards the next target of 1300 early in the new year. However in saying that there are signs that of divergences building up with internal market indicators. This last upswing since the November highs has occurred with narrowing breadth, decreasing volume, lesser number of net highs and lower cumulative ticks. All course this could all change but you would have to remain cautious without this confirmation of the current price action. Indeed this type of a divergence was prevalent towards the latter part of 2007 and culminated with the massive bear market the following year so one needs to be careful. We have had a large amount of market intervention by the Fed (POMO for instance) and other central banks and this could be what's holding the market up.
I suspect that major structural flaws in the financial system (that of over indebtedness) will only become a huge problem when all the quick fixes and solutions don't appear to work anymore. Right now we are seeing bonds selling off across the board (especially in sovereigns) and longer term interest rates rising. This will become a limiting factor as to how much more easing the central banks can do. For 2011, inflation and rising bond yields will become the big theme. Whilst right now this isn't so much of a concern as it suggests an improving global economy, it could ultimately prove to be a negative on stocks especially if unemployment remains high and we get some kind of sharp spike caused by sovereign default for example. The Chinese inflation story is also a worry as the path that they are on is clearly not sustainable. Of course I expect the stock market to discount these fundamental problems and overvalue itself just as it did with the U.S. housing market back when problems first surfaced in 2006. This is because I believe markets and their behavior are largely built on riding the trend for as long as possible, herd behavior and short-term-ism approach (especially true in today's high frequency, algorithm and robot dominated trading).
Thursday, December 2, 2010
Wednesday thoughts
It's all about Europe right now. CDS for the Sovereigns in trouble this week hit all time highs and we are by no means out of the woods. Not sure if today is some sort of oversold bounce and traders pre-empting that the ECB which meet tomorrow are going to something supportive of the credit markets. Hard to see any action being more than just another short term solution as the current crisis has more to do with confidence of whether governments will be able to reign in spending enough to meaningfully reduce deficits before a bailout is required. You can bet that anymore bailouts is going to see more anger from the taxpayers of countries supplying the moolah (ie Germany) and greater demands on bondholders to take haircuts. Anyway my GOOG position got runover yesterday with a fairly nice drop but it is popping nicely today. I took the opportunity to reduce some risk by buying one of the BWB's but also I think we will hold the 550 level so I added another BWB but with the strikes one strike down. ie 570/560/540. The OEX is holding up well. The levels to watch right now are 1200 and 1170 on the ES. Bullish if we can close above 1200 and bearish if we break below.
Saturday, November 27, 2010
Weekend thoughts
One should keep a careful tab on with the situation going on with the European debt situation. At this stage, I get the feeling that it has the potential to really spook the markets just like Greece. If the governments make good on their statements to make bond holders take a hit for any restructuring then watch out. It's the implicit assertion that bond holders will not lose out in any bail out that has been holding up the credit markets. Once this changes then you will start seeing money fleeing the PIIGS and that could get ugly. If the recent tape action wasn't so wild and volatile then I would say that the chances of this happening would be slim but this hasn't been the case. There is certainly a degree of risk aversion out there and this has the potential to blow out.
Wednesday, November 24, 2010
Interesting divergence
An interesting divergence occurred in yesterday's session. Whilst breadth and A/D lines were very weak, cumulative ticks fluctuated up and down to only finish marginally weaker at -10,000. This to me would indicate that not all the sentiment is bearish as buyers are still hitting their fair share of offers as opposed to seller's hitting the bids. Seasonalities are very bullish today and for Friday so don't be surprised if we get some kind of pop here.
I couldn't help but sell some volatility yesterday in the form of a OEX Dec Put BWB. Strikes are 525/520/510 for a $0.60 credit. Only did a half sized order in case this market really does fall apart.
We shall see how it goes.....
I couldn't help but sell some volatility yesterday in the form of a OEX Dec Put BWB. Strikes are 525/520/510 for a $0.60 credit. Only did a half sized order in case this market really does fall apart.
We shall see how it goes.....
Tuesday, November 23, 2010
Risk off again!
Well all is quiet on the trade front for myself today other than a GOOG Dec Put BWB with strikes at 590/580/570 as mentioned last time. The trade is down around $40 at the moment.
Internals last night finished positive with cumulative ticks at +25,000. However as you can see from the futures today we are very close to gapping below yesterday's low on the ES of 1182.50. This will be an important level to watch as I'm sure there will be stops just below this so if it goes then expect a move back to the 1177 area. Should be interesting to see how the market reacts to all this negative news. All the quant studies and seasonalities would suggest bullish implications in the next few days but judging from the recent tape action, fundamental news are trumping all of these. I'm inclined to wait it out and see. (Actually I have a small day trade on the ES. Looking to fade the gap fill today and will be short at 1190 if we get there targeting 1185 with a 3.5 point stop.).
Internals last night finished positive with cumulative ticks at +25,000. However as you can see from the futures today we are very close to gapping below yesterday's low on the ES of 1182.50. This will be an important level to watch as I'm sure there will be stops just below this so if it goes then expect a move back to the 1177 area. Should be interesting to see how the market reacts to all this negative news. All the quant studies and seasonalities would suggest bullish implications in the next few days but judging from the recent tape action, fundamental news are trumping all of these. I'm inclined to wait it out and see. (Actually I have a small day trade on the ES. Looking to fade the gap fill today and will be short at 1190 if we get there targeting 1185 with a 3.5 point stop.).
Thursday, November 18, 2010
Thursday thoughts
Risk off. Risk on. Risk taking appetite is back. I think the ES has a very good chance of retesting 1200 from here. Today looks to me like a gap and go situation. Because of the bullish sentiment I've decided to take off my OEX BWB right here. Just sold out 4 contracts for $0.55 debit and was going to hold the other 2 as lotto tickets but I have decided to take my money here and have put in a order to sell those two out as well as I don't think this fly will finish in the money. Internals are very strong so far off the open.
Wednesday, November 17, 2010
Wednesday morning update
Internals are improving after starting off weak, but the ES is still having trouble clearing resistance at 1180. I still expect us to take this out eventually (we are popping as I type this). Anyway I think there will be limited downside today in the small chance we do finish negative. We'll see what happens. Weakest sectors are homebuilders, and the financials. Strongest sector is gold, oil and semi conductors. I expect today to be an oversold bounce. I don't think the market is out of the woods by any stretch but we shall see.
Internals are still terrible.......
It is 11.30am ET and the internals still stink. It's probably going to be a nice trend day for the bears. Cumulative ticks are not showing any signs of bottoming yet..........
Just bought some OEX BWB's
Taking a bit of punt that we will bounce tomorrow or on Friday. Just bought a few OEX Put BWB's expiring this week. Strikes at 535/530/520. Averaged the trade in for even.
I also have a GOOG BWB for December expiration as well. Strikes at 5980/580/560. Got this one filled for yesterday. GOOG is holding right at the 23.6% fibbo level.
I also have a GOOG BWB for December expiration as well. Strikes at 5980/580/560. Got this one filled for yesterday. GOOG is holding right at the 23.6% fibbo level.
Tuesday, November 16, 2010
Tuesday morning heads up
Internals are extremely weak today. A/D lines are very bearish already and breadth and cumulative ticks are just heading straight down. Listening to trader's audio and we have lots of paper sellers. Looks like the risk aversion trade is in full flight. Interestingly the 30 year bond is still copping a hammering. Looks like everyone is getting out of the long end of the curve..........It's a given when you can front run the Fed on the shorter end which is what Ben and his cohorts are buying. At this point in time, I'm looking for a quick bounce off the fibbo but the selling might not be over with all the fundamental issues out there. Like they say whatever goes up fast comes down even faster. We have had one heck of a run up so taking the elevator on the way down is not a surprise.
Monday, November 15, 2010
Monday 15th November thoughts
I think we might see some more selling to come. Personally I think so long as there is no clear resolution on the European debt situation, the market is likely to be jittery. All the stats and studies being presented by the quants that I follow all point to a higher market in the intermediate term so I'm looking to get long at a well defined support level. The first one that pops to my mind is the 1180 level which corresponds to the recent area of congestion and is where the first fibbo level (23.6% retracement is located). I have a chart of this below.

I'm looking to use futures to take advantage of the situation firstly by drilling down to the shorter term time frame charts like the 15min and using the daily pivot levels as my entry points. I use the following pivot levels as price targets below. The first chart shows the regular floor trader pivots whilst the second shows the person pivot levels on a weekly and daily basis.


I've found that looking for longer term inflection points and then trading these levels on shorter term charts has been a pretty decent setup in the past. Just on Friday, I took at trade at trend line support on the ES at 1194.00 and held the trade over the weekend to close at 1200 for a 6 point winner.
Anyway so long as the European debt issue remains unresolved (and it will for some time - just think back to Greece where the ECB was forced to do something only after markets had been well and truly spooked.) It will be a good excuse for this market to take profits. I'd be building a list of strong stocks that are coming off the recent highs as good candidates to get long. Names such as AAPL, PCLN and other names come to mind. There's also the Chinese rates thing to contend with (another excuse??) so if you are long, then tread carefully as the recent selling are clear warning shots across the bow of the current uptrend. As always though I do expect the markets to eventually bounce back and move higher given the easy monetary conditions.

I'm looking to use futures to take advantage of the situation firstly by drilling down to the shorter term time frame charts like the 15min and using the daily pivot levels as my entry points. I use the following pivot levels as price targets below. The first chart shows the regular floor trader pivots whilst the second shows the person pivot levels on a weekly and daily basis.


I've found that looking for longer term inflection points and then trading these levels on shorter term charts has been a pretty decent setup in the past. Just on Friday, I took at trade at trend line support on the ES at 1194.00 and held the trade over the weekend to close at 1200 for a 6 point winner.
Anyway so long as the European debt issue remains unresolved (and it will for some time - just think back to Greece where the ECB was forced to do something only after markets had been well and truly spooked.) It will be a good excuse for this market to take profits. I'd be building a list of strong stocks that are coming off the recent highs as good candidates to get long. Names such as AAPL, PCLN and other names come to mind. There's also the Chinese rates thing to contend with (another excuse??) so if you are long, then tread carefully as the recent selling are clear warning shots across the bow of the current uptrend. As always though I do expect the markets to eventually bounce back and move higher given the easy monetary conditions.
Earnings play wrap up Q3 2010
Hi folks. My apologies for the lack of posts and poor notice. I just got back from holidays over in Malaysia. Anyway here is the wrap up of my earnings plays for Q3.

AAPL
2 x 290/280/260 Put BWB opened for $0.12 credit and closed for a $0.29 credit. Total return was $0.41.
2 x 360/370/290 Call BWB opened for $0.15 credit and closed for a $0.02 credit. Total return was $0.17.
Total return for AAPL was $0.68 on $9.32 of risk which gives a ROI of 7.02%

GS
4 x 150/145/135 Put BWB opened for $0.05 credit and closed for a $0.16 credit. Total return $0.21 on $4.79 of risk gives ROI of 4.38%.

GOOG
2 x 510/500/480 Put BWB opened for $0.69 credit and closed for a $0.02 debit. Total return $0.67 on $9.31 risk gives ROI of 7.2%

ESI
4 x 60/55/45 Put BWB opened for $0.13 credit and closed for a $0.49 credit. Total return $0.62 on $4.38 of risk gives ROI of 14.2%

AMZN
6 x 150/145/135 Put BWB opened for $0.41 credit and closed for $0.03 debit. Total return of $0.38 on $4.59 of risk gives ROI of 8.3%

NFLX
8 x 140/135/125 Put BWB opened for $0.62 credit and closed for $0.05 debit. Total return of $0.57 credit.
8 x 175/180/190 Call BWB opened for $0.23 credit.
Adjustment of 4 x 185/190 call vertical for $1.48 debit. (bought)
Adjustment of 4 x 185/190 call vertical for $1.64 debit. (bought)
Adjustment of 6 x 175/180 call vertical for $0.34 credit. (sold)
Adjustment of 2 x 175/180 call vertical for $0.51 credit. (sold)
Total loss of $302 on max risk of $3320 gives ROI of -9.1%.

BIDU
4 x 115/120/130 Call BWB opened for $0.16 credit.
Adjustment of 2 x 125/130 call vertical for $0.37 debit. (bought)
Adjustment of 1 x 125/130 call vertical for $0.55 debit.
Sold 3 x 115/120/125 call butterfly for $0.42 debit.
Sold 115/120/130 call BWB for $0.30 credit.
Total gain of $91 on max risk of $484 gives ROI of 4.7%.

PCLN
4 x 330/320/300 Put BWB opened for $0.55 credit.
Adjustment of 2 x 310/300 Put vertical for $0.48 debit.
Total gain of $124 on max risk of $3780 gives ROI of 3.28%.
Q3 EARNINGS PLAY SUMMARY
Total gain was $743 (not including commissions which was significant $198 and that's after I'm on a significant discount with TOS). Total return therefore was $545 and average ROI on the positive trades around 6.5% (although based on actual margin requirements, it would be only 3.25% due to current FINRA rules).
Closing remarks: The profitability versus the probability payoff seems to be right on the money here. Most of my long options were placed right at or just beyond the 1st deviation mark with my breakeven around the 2 std deviation mark (95%). Therefore I had a high probability of these trades working out for me (20:1 odds). Therefore you could say that the 6.5% ROI is about right given I had about 95% odds in my favour.
Is the effort worth the reward you might ask? Knowing that all it takes is one of these tickers to move way beyond the breakeven for all the good work to be undone. I don't know. I have the feeling that it is more hardwork than it is but in the context of the current options income trading conditions, finishing in the black on any income strategy from what I can gather is a pretty rare occurrence these days. Will I continue with this strategy into Q4? Probably given that I still some edge and there is always the off chance that I will be able to get more than a one strike separation from my long to short option and so extract greater value (hit a home run). I will probably mix it up a bit and use weekly options where I can (GOOG, GS and AAPL). Also I will not forget to add RIMM, MA and ISRG to the tickers above as these are the other ones I normally trade as well.

AAPL
2 x 290/280/260 Put BWB opened for $0.12 credit and closed for a $0.29 credit. Total return was $0.41.
2 x 360/370/290 Call BWB opened for $0.15 credit and closed for a $0.02 credit. Total return was $0.17.
Total return for AAPL was $0.68 on $9.32 of risk which gives a ROI of 7.02%

GS
4 x 150/145/135 Put BWB opened for $0.05 credit and closed for a $0.16 credit. Total return $0.21 on $4.79 of risk gives ROI of 4.38%.

GOOG
2 x 510/500/480 Put BWB opened for $0.69 credit and closed for a $0.02 debit. Total return $0.67 on $9.31 risk gives ROI of 7.2%

ESI
4 x 60/55/45 Put BWB opened for $0.13 credit and closed for a $0.49 credit. Total return $0.62 on $4.38 of risk gives ROI of 14.2%

AMZN
6 x 150/145/135 Put BWB opened for $0.41 credit and closed for $0.03 debit. Total return of $0.38 on $4.59 of risk gives ROI of 8.3%

NFLX
8 x 140/135/125 Put BWB opened for $0.62 credit and closed for $0.05 debit. Total return of $0.57 credit.
8 x 175/180/190 Call BWB opened for $0.23 credit.
Adjustment of 4 x 185/190 call vertical for $1.48 debit. (bought)
Adjustment of 4 x 185/190 call vertical for $1.64 debit. (bought)
Adjustment of 6 x 175/180 call vertical for $0.34 credit. (sold)
Adjustment of 2 x 175/180 call vertical for $0.51 credit. (sold)
Total loss of $302 on max risk of $3320 gives ROI of -9.1%.

BIDU
4 x 115/120/130 Call BWB opened for $0.16 credit.
Adjustment of 2 x 125/130 call vertical for $0.37 debit. (bought)
Adjustment of 1 x 125/130 call vertical for $0.55 debit.
Sold 3 x 115/120/125 call butterfly for $0.42 debit.
Sold 115/120/130 call BWB for $0.30 credit.
Total gain of $91 on max risk of $484 gives ROI of 4.7%.

PCLN
4 x 330/320/300 Put BWB opened for $0.55 credit.
Adjustment of 2 x 310/300 Put vertical for $0.48 debit.
Total gain of $124 on max risk of $3780 gives ROI of 3.28%.
Q3 EARNINGS PLAY SUMMARY
Total gain was $743 (not including commissions which was significant $198 and that's after I'm on a significant discount with TOS). Total return therefore was $545 and average ROI on the positive trades around 6.5% (although based on actual margin requirements, it would be only 3.25% due to current FINRA rules).
Closing remarks: The profitability versus the probability payoff seems to be right on the money here. Most of my long options were placed right at or just beyond the 1st deviation mark with my breakeven around the 2 std deviation mark (95%). Therefore I had a high probability of these trades working out for me (20:1 odds). Therefore you could say that the 6.5% ROI is about right given I had about 95% odds in my favour.
Is the effort worth the reward you might ask? Knowing that all it takes is one of these tickers to move way beyond the breakeven for all the good work to be undone. I don't know. I have the feeling that it is more hardwork than it is but in the context of the current options income trading conditions, finishing in the black on any income strategy from what I can gather is a pretty rare occurrence these days. Will I continue with this strategy into Q4? Probably given that I still some edge and there is always the off chance that I will be able to get more than a one strike separation from my long to short option and so extract greater value (hit a home run). I will probably mix it up a bit and use weekly options where I can (GOOG, GS and AAPL). Also I will not forget to add RIMM, MA and ISRG to the tickers above as these are the other ones I normally trade as well.
Subscribe to:
Posts (Atom)