Thursday, December 30, 2010
Heads up for Thursday's session
Big divergence between price, breadth, A/D lines and the ticks. Whilst the first 3 all finished positive, ticks trended down the whole session with cumulative ticks finishing at -50,000. Definitely shows that the bids were getting hit more than the ask. Perhaps a sign that some of the smart money is locking in their gains for the year or taking some profits at this point? The futures are trading in a tight range right now so it will be interesting to see where price breaks to in the new year.
Wednesday, December 29, 2010
Totally flat!
I have no positions on at the moment. I covered my ES long at 1252.50 on Monday's afternoon session as I wasn't feeling all that bullish after the pre-market sell off on the weekend on the news China had raised its interest rates. A bit of emotions probably got to me especially after I had held my long as the ES got to a low of 1245. I was also away from my trading computer and did not see that cumulative ticks trended up the entire day to finish at +70,000 or else I would have moved my profit stop at 1256 (retest of the highs).
My profit stop on the short 125/128 call spread on the long bond was hit yesterday as treasuries tanked (they've been pretty volatile of late). I sold it for 16 and bought it back for 6 so that makes 10 ticks on $15.625 per tick per contract. That's a pretty good trade considering an ROI of 18% ($625/$3400) on a 8 day trade.
FYI, quant studies still point to more bullish action ahead but sentiment is nearing bullish extremes which I don't really feel comfortable with. Under the hood, the tape action has been strong all week with another +30,000 finish last session on the ticks. Volume as you would expect is extremely light so I'm not sure you can look into it too much. I do see the VIX has bottomed and small caps and tech have slightly underperformed the last 2 days so perhaps that is good reason to wait things out and see where this market wants to go. Remember volatility has typically picked up early in Jan so that might be good reason for those that have sold some option premium to start taking some profits.
Enjoy the rest of the holiday folks and have a great new year if I don't post again.
Friday, December 24, 2010
Using the pivots to setup my trades
As promised here are some screenshots (TOS platform) of my entries for my futures trades yesterday.
 As you can see I like to view all 4 different time frames with this tool and I also have the Persons Proprietary indicator on (the yellow and blue arrows). I use a weekly time frame pivot for the daily chart and a daily time frame for the other 3 (hourly, 15min and 5min). This wasn't a perfect entry as the low of the day was 1249.25 but it's good enough as the ES found support and rallied off it. If you had use the regular floor trader pivots (see screen shot below), you may have gotten a better entry as the ES bounced off that support perfectly.

The last screen shot shows the TF and you can see how I missed the entry because I placed my order at S2 and not at S1 (was more conservative as the TF moves more and is more highly leveraged).


The last screen shot shows the TF and you can see how I missed the entry because I placed my order at S2 and not at S1 (was more conservative as the TF moves more and is more highly leveraged).

Patience pays off!
I am long ES at 1250. All day I had 2 orders in, one on the ES and one on the TF (@784.30). I got these price levels by using Person's (of John Person fame) pivots which is my favourite type of pivot to use. So now I will probably set a tight stop and sit tight with this trade and let the seasonal factors take me through to the New Year. I hoping for a monster first couple of trading days in January (historically realized vols on the first 2 days is almost double the average trading day realised vol - last year was no exception and it was to the upside). A repeat of that performance from last year and I will be looking to close. Either way I will sit tight. I was a bit more conservative with the TF trade on the entry and that was why I set the entry price at S2 instead of S1 like I did with the ES. Reasons are that the TF is more leveraged than the ES (1 point move on 1 contract equals $100 whereas the ES is $50). Both futures bounced off the pivots perfectly which is why I use pivots to trade the futures. (I will post screenshots later).
January 2011 thoughts
I see continued quantitative evidence for the rally to continue in the intermediate term. However, the further we rally the higher the probabilities of a correction before we continue to go higher. This will be my prediction going forward. We may get further upside early January but I'd be looking for some sort of correction (catalyst unknown but I'm thinking Europe sovereign or China rate concerns) before we set off again. I'm absolutely positive that any sell off will present another buying opportunity just based on how strong the tape readings have been. I can't see a change in the overall nature of the market from a bull to a bear (this normally takes time anyways as all the research shows that markets don't suddenly reverse from a bull to a bear but tops take time to form). We still have ultra low interest rates in the advanced economies (ie a very steep yield curve), accommodative government and central bank policies, equities are still cheap relative to bonds, economic data improving and the market is trending up (so you have to give it the benefit of the doubt).
I just wish at this point that we actually get a nice down day so I can get long again!
I just wish at this point that we actually get a nice down day so I can get long again!
Wednesday, December 22, 2010
Oops I lied
Forgot I had a short Jan 125/128 call spread order working on the 30 year UST or the ZB. I just got filled at "16 credit. I am very bearish on treasuries in the longer term and bonds in general because of:
1) Higher risk premiums to hold debt due to sovereign concerns, municipality concerns etc etc
2) Excessive money printing by the Fed ie feeding inflation fears as economic data improves
3) Money rotating out of bonds and into equities which are still cheap in comparison
I am looking to be a seller of every UST rally going forward but will swing trade it over the longer term timeframe. ie I will be looking to cover my short call spreads when we hit levels where I think price will bottom temporarily. For this trade that will be at 119'10.
The only thing I fear for this trade is the "flight to safety" trade if we get some repeat of the flash crash and everyone runs to buy the safest and most liquid assets out there which is still USTs but even that will diminish over time as the US deficit grows and it's credit rating may subjected to a downgraded.
Tuesday morning update
It's a real chop fest out there today and odds are we are probably going to stay that way. Ticks are now trending sideways and so are other intenals. Great market if you've sold some premium, otherwise you are better off playing online poker or something if you want some action. It's times like this where you have to stay disciplined and not force a trade. Seasonals and other stats still favour end of year strength but the market is now quite overbought. Perhaps it's the POMO effect kicking in??
Tuesday, December 21, 2010
Monday wrap up
I got long yesterday on the TF at 777.1 as the market was showing some slight weakness. Unfortunately I couldn't stomach holding the trade as ticks were still trending negative at 10.30am so I exited at 778.3 for $120 per contract. No real edge in trading here today as the market holds the early morning gap. Ticks are trending lower though and other internals have come off the highs. Still any weakness is likely to be bought as that remains the layup trade for the last week so any short would basically be a 2-3 point trade with a great entry close to the high of the day. No real option trades either on the indexes as most of the holiday premium has been priced out.
Friday, December 17, 2010
Thursday session recap
All market internal indicators finished positive yesterday. A/D lines closed at close to 1000 on both the NYSE and Naz while breadth finished close to 70% positive for both exchanges. Cumulative ticks also finished positive at around 25,000 which is something it hasn't done for a while. Actually the divergence between the early morning tick action which started to turn before the price on the indexes, lead me to take a long trade on the TF (Russell 2000 e-mini futures). I chose the TF because Rob Hanna from quantifiable edges (of which I'm a subscriber) research has shown that the Russell shows a high level of bullishness at this time of the year relative to the other majors. Whatever the case, I got long at 768.9 and closed out at 773.7 for a nice gain of $480 per contract. It would have been more but such is one of my bad habits and character weaknesses in trading these highly leverage instruments I have not been able to control my fear/greed and moved my profit stop down from 775 so that I could go to sleep with the a profit in the bag. As always one should master the discipline that comes from trading the plan.
This morning when I woke up, I saw the news that MA and V had both lost 10% because of proposed legislation to cut credit card fees. I thought that this might be an opportunity to throw on my favourite BWB trades which are contrarian in nature and benefit from selling high skew. Alas when I went to check if I could construct any trades for Jan expiration I found that I couldn't which means that skew is low implying that this sell off is perhaps a once off and the market is not expecting much further downside. Perhaps a calendar might be worth investigating especially for those that understand the concept of weighted vega (see my mentor Mark Sebastian's many informative posts about this over at Option Pit).
Anyway the outlook for Option Ex today is bullish according to seasonal factors and other statistical factors. Note that strength on OpEx Friday may also induce weakness on the Monday as well. If you like to know what the probabilities are and are into this quant type of information then it pays to subscribe to Wayne Whaley's emails by emailing wayne@witterlester.com with subject ‘Add to Daily Email’, or vice versa for deletions.
My own feelings is that this market still looks a bit heavy and if it were not for all the bullish factors in play we would probably have already come back down and tested the 20 day moving average at 1214 on the ES. So I'm still hesistant to hold longs for longer than a day. Bonds continue to come under pressure as more stimulus and improving economic numbers as well as other factors lead the market to pricing in higher interest rates. A good blog on that by Surly trader is posted here. Again this is a natural part of the fundamental structural shift in the market where the market is no longer pricing in recovery but growth. In my opinion, I believe the equity bear won't be coming back until we start to see an inverted yield curve and that will only happen when the Fed begins to raise rates. Expect that to happen end of 2011 or early 2012, till then it's higher we go with the occasional 10% correction thrown in.
Posting will probably be light heading into Christmas and the New Year so with that I would like to wish all of you a Christmas filled with lots of love, laughter and food and a happy and prosperous new year!
Wednesday, December 15, 2010
Different day but same divergences
Well another remarkable day in that market internals all finished in the red with negative breadth and A/D lines and cumulative ticks finishing in at -40,000 but price actually finished positive on the day. Go figure. This is a very rare set of circumstances indeed. On another front bonds are getting smashed and yields are rising very quickly. Again it would appear that we are about to enter a new phase in the markets. I still think we will go higher from here but the fundamentals are definitely shifting. This may be the last leg up in this bull market before the bear returns.
Tuesday, December 14, 2010
Rally is running on fumes!
Well another day and another massive divergence between NYSE tick action and price. Whilst we managed a pretty flat session, under the hood cumulative ticks finished at a whopping -120,000. Quite a rare setup in historical terms. CBOE put to call ratios continue to come in extremely low (sub 0.50) which has bearish implications looking out a couple of months. The feeling I get is that when this abnormal resiliency of the market ends, get ready for a very sharp and quick move down. In fact I wouldn't be surprised if we get some sort of a contrived down day (ie sell off 3% on really heavy volume and breadth) soon. I bet you all the retail traders are long right now and we are right at the 61.8% fibbo retracement level on the weekly charts from the 2007 highs so expect some resistance here.
Monday, December 13, 2010
Monday morning update
Internals are flat but quite a divergence with the ticks as it is trending negatively. Historically Dec Op Ex week is one of the strongest of the year. It would appear that all of the seasonal tendencies are playing out. I wonder what happens when the smart money starts taking money off in the New Year. Anyway from the tape action, it's clear that this market will just not go down. Blame it on the Fed's POMO but whatever it is, it just isn't providing a good opportunity to get long again as I'm still waiting for a half decent dip.
Thursday, December 9, 2010
Morning update
Cumulative ticks are trending solidly negative right now. Other internals are all weakening suggesting lower prices. Probably will be a range trading day today. I'm not expecting a breakout but you never know. With end of year window dressing I still think this market will be bought at lower levels. Volatility is coming in a bit too. Exited the ES trade earlier today at 1235 for 15 point winner. (Now if only everyday was like that!!). Still holding onto the GOOG and OEX trade.
Trade update & quick recap
I went long on the ESZ0 at 1220 yesterday. I have a trailing stop on this at 1228 and am going to ride this for as long as I can (It's at 1233.50 right now). This trade is made because as explained in my previous post, the stats all point to higher prices next week and I do expect some sort of Xmas rally. What's concerning though is that the last session showed a large amount of divergence. Cumulative ticks finished at -50,000 which is quite bearish and A/D lines were -600 on the NYSE and flat on the Nasdaq. Breadth was the only thing that was positive but even that was quite weak on the NYSE especially. What this tells me is that the rally is narrowing greatly. The only plausible explanation is that all the money right now is flowing into the heavily weighted large cap names which is why the A/D lines can finish negative but the major indexes still finished positive last night with the exception of the RUT (small cap index) which only confirms my hunch. This would also explain the cumulative tick behavior of late. I would be surprised if we had a major sell off so close to Christmas and with the Fed's POMO operation in full swing but you never know......
The OEX BWB trade has made all the money that it can ($0.60 credit), whilst GOOG has rebounded nicely to 590. The original BWB is now trading for around a credit of ($0.40) to take off as the options expire next week. I may think of doing an adjustment soon. Perhaps something like a "Reverse Harvey" (buying back the cheap short put spread) to lock in the profit and reduce risk.
The OEX BWB trade has made all the money that it can ($0.60 credit), whilst GOOG has rebounded nicely to 590. The original BWB is now trading for around a credit of ($0.40) to take off as the options expire next week. I may think of doing an adjustment soon. Perhaps something like a "Reverse Harvey" (buying back the cheap short put spread) to lock in the profit and reduce risk.
Wednesday, December 8, 2010
End of year thoughts
Well the market has made a nice move higher since my last post which was not that long ago. What a difference a week makes hey? We managed to get above 1200 and then moved very quickly back to the old swing highs where we now roughly sit. Whilst the ECB did not announce any new measures they did hint that they would do what was necessary and showed this to the market by buying Irish and Portuguese bonds through their Securities Market Program on the day of the announcement. However, the European sovereign debt saga is definitely not over (will it ever be??) and personally I would expect future shocks to come as there is still no agreement on how to deal with the situation. At the end of the day some form of restructuring is going to have to take place. Expect in the interim for the ECB to start expanding it's bond buying program in the meantime. If and when Axel Weber gets in then that could all change. In other news the U.S. unemployment rate ticked up to 9.8% but this news was offset by a big spike in pending home sales. Overall the data coming out of the U.S. is improving but unemployment is not which is going to give the Fed another mandate to add even more liquidity to the system with QE3 probably sometime in the middle of next year.
As for predictions going forward, most of the historical data and statistics suggest high probabilities for further intermediate term strength (which is where I'm leaning). Seasonally we get the usual Xmas rally around this time of the year and I expect nothing different to happen this year (most traders will be on holidays so expect any big moves to come in the new year). I can see the SPX moving towards the next target of 1300 early in the new year. However in saying that there are signs that of divergences building up with internal market indicators. This last upswing since the November highs has occurred with narrowing breadth, decreasing volume, lesser number of net highs and lower cumulative ticks. All course this could all change but you would have to remain cautious without this confirmation of the current price action. Indeed this type of a divergence was prevalent towards the latter part of 2007 and culminated with the massive bear market the following year so one needs to be careful. We have had a large amount of market intervention by the Fed (POMO for instance) and other central banks and this could be what's holding the market up.
I suspect that major structural flaws in the financial system (that of over indebtedness) will only become a huge problem when all the quick fixes and solutions don't appear to work anymore. Right now we are seeing bonds selling off across the board (especially in sovereigns) and longer term interest rates rising. This will become a limiting factor as to how much more easing the central banks can do. For 2011, inflation and rising bond yields will become the big theme. Whilst right now this isn't so much of a concern as it suggests an improving global economy, it could ultimately prove to be a negative on stocks especially if unemployment remains high and we get some kind of sharp spike caused by sovereign default for example. The Chinese inflation story is also a worry as the path that they are on is clearly not sustainable. Of course I expect the stock market to discount these fundamental problems and overvalue itself just as it did with the U.S. housing market back when problems first surfaced in 2006. This is because I believe markets and their behavior are largely built on riding the trend for as long as possible, herd behavior and short-term-ism approach (especially true in today's high frequency, algorithm and robot dominated trading).
Thursday, December 2, 2010
Wednesday thoughts
It's all about Europe right now. CDS for the Sovereigns in trouble this week hit all time highs and we are by no means out of the woods. Not sure if today is some sort of oversold bounce and traders pre-empting that the ECB which meet tomorrow are going to something supportive of the credit markets. Hard to see any action being more than just another short term solution as the current crisis has more to do with confidence of whether governments will be able to reign in spending enough to meaningfully reduce deficits before a bailout is required. You can bet that anymore bailouts is going to see more anger from the taxpayers of countries supplying the moolah (ie Germany) and greater demands on bondholders to take haircuts. Anyway my GOOG position got runover yesterday with a fairly nice drop but it is popping nicely today. I took the opportunity to reduce some risk by buying one of the BWB's but also I think we will hold the 550 level so I added another BWB but with the strikes one strike down. ie 570/560/540. The OEX is holding up well. The levels to watch right now are 1200 and 1170 on the ES. Bullish if we can close above 1200 and bearish if we break below.
Saturday, November 27, 2010
Weekend thoughts
One should keep a careful tab on with the situation going on with the European debt situation. At this stage, I get the feeling that it has the potential to really spook the markets just like Greece. If the governments make good on their statements to make bond holders take a hit for any restructuring then watch out. It's the implicit assertion that bond holders will not lose out in any bail out that has been holding up the credit markets. Once this changes then you will start seeing money fleeing the PIIGS and that could get ugly. If the recent tape action wasn't so wild and volatile then I would say that the chances of this happening would be slim but this hasn't been the case. There is certainly a degree of risk aversion out there and this has the potential to blow out.
Wednesday, November 24, 2010
Interesting divergence
An interesting divergence occurred in yesterday's session. Whilst breadth and A/D lines were very weak, cumulative ticks fluctuated up and down to only finish marginally weaker at -10,000. This to me would indicate that not all the sentiment is bearish as buyers are still hitting their fair share of offers as opposed to seller's hitting the bids. Seasonalities are very bullish today and for Friday so don't be surprised if we get some kind of pop here.
I couldn't help but sell some volatility yesterday in the form of a OEX Dec Put BWB. Strikes are 525/520/510 for a $0.60 credit. Only did a half sized order in case this market really does fall apart.
We shall see how it goes.....
I couldn't help but sell some volatility yesterday in the form of a OEX Dec Put BWB. Strikes are 525/520/510 for a $0.60 credit. Only did a half sized order in case this market really does fall apart.
We shall see how it goes.....
Tuesday, November 23, 2010
Risk off again!
Well all is quiet on the trade front for myself today other than a GOOG Dec Put BWB with strikes at 590/580/570 as mentioned last time. The trade is down around $40 at the moment.
Internals last night finished positive with cumulative ticks at +25,000. However as you can see from the futures today we are very close to gapping below yesterday's low on the ES of 1182.50. This will be an important level to watch as I'm sure there will be stops just below this so if it goes then expect a move back to the 1177 area. Should be interesting to see how the market reacts to all this negative news. All the quant studies and seasonalities would suggest bullish implications in the next few days but judging from the recent tape action, fundamental news are trumping all of these. I'm inclined to wait it out and see. (Actually I have a small day trade on the ES. Looking to fade the gap fill today and will be short at 1190 if we get there targeting 1185 with a 3.5 point stop.).
Internals last night finished positive with cumulative ticks at +25,000. However as you can see from the futures today we are very close to gapping below yesterday's low on the ES of 1182.50. This will be an important level to watch as I'm sure there will be stops just below this so if it goes then expect a move back to the 1177 area. Should be interesting to see how the market reacts to all this negative news. All the quant studies and seasonalities would suggest bullish implications in the next few days but judging from the recent tape action, fundamental news are trumping all of these. I'm inclined to wait it out and see. (Actually I have a small day trade on the ES. Looking to fade the gap fill today and will be short at 1190 if we get there targeting 1185 with a 3.5 point stop.).
Thursday, November 18, 2010
Thursday thoughts
Risk off. Risk on. Risk taking appetite is back. I think the ES has a very good chance of retesting 1200 from here. Today looks to me like a gap and go situation. Because of the bullish sentiment I've decided to take off my OEX BWB right here. Just sold out 4 contracts for $0.55 debit and was going to hold the other 2 as lotto tickets but I have decided to take my money here and have put in a order to sell those two out as well as I don't think this fly will finish in the money. Internals are very strong so far off the open.
Wednesday, November 17, 2010
Wednesday morning update
Internals are improving after starting off weak, but the ES is still having trouble clearing resistance at 1180. I still expect us to take this out eventually (we are popping as I type this). Anyway I think there will be limited downside today in the small chance we do finish negative. We'll see what happens. Weakest sectors are homebuilders, and the financials. Strongest sector is gold, oil and semi conductors. I expect today to be an oversold bounce. I don't think the market is out of the woods by any stretch but we shall see.
Internals are still terrible.......
It is 11.30am ET and the internals still stink. It's probably going to be a nice trend day for the bears. Cumulative ticks are not showing any signs of bottoming yet..........
Just bought some OEX BWB's
Taking a bit of punt that we will bounce tomorrow or on Friday. Just bought a few OEX Put BWB's expiring this week. Strikes at 535/530/520. Averaged the trade in for even.
I also have a GOOG BWB for December expiration as well. Strikes at 5980/580/560. Got this one filled for yesterday. GOOG is holding right at the 23.6% fibbo level.
I also have a GOOG BWB for December expiration as well. Strikes at 5980/580/560. Got this one filled for yesterday. GOOG is holding right at the 23.6% fibbo level.
Tuesday, November 16, 2010
Tuesday morning heads up
Internals are extremely weak today. A/D lines are very bearish already and breadth and cumulative ticks are just heading straight down. Listening to trader's audio and we have lots of paper sellers. Looks like the risk aversion trade is in full flight. Interestingly the 30 year bond is still copping a hammering. Looks like everyone is getting out of the long end of the curve..........It's a given when you can front run the Fed on the shorter end which is what Ben and his cohorts are buying. At this point in time, I'm looking for a quick bounce off the fibbo but the selling might not be over with all the fundamental issues out there. Like they say whatever goes up fast comes down even faster. We have had one heck of a run up so taking the elevator on the way down is not a surprise.
Monday, November 15, 2010
Monday 15th November thoughts
I think we might see some more selling to come. Personally I think so long as there is no clear resolution on the European debt situation, the market is likely to be jittery. All the stats and studies being presented by the quants that I follow all point to a higher market in the intermediate term so I'm looking to get long at a well defined support level. The first one that pops to my mind is the 1180 level which corresponds to the recent area of congestion and is where the first fibbo level (23.6% retracement is located). I have a chart of this below.

I'm looking to use futures to take advantage of the situation firstly by drilling down to the shorter term time frame charts like the 15min and using the daily pivot levels as my entry points. I use the following pivot levels as price targets below. The first chart shows the regular floor trader pivots whilst the second shows the person pivot levels on a weekly and daily basis.


I've found that looking for longer term inflection points and then trading these levels on shorter term charts has been a pretty decent setup in the past. Just on Friday, I took at trade at trend line support on the ES at 1194.00 and held the trade over the weekend to close at 1200 for a 6 point winner.
Anyway so long as the European debt issue remains unresolved (and it will for some time - just think back to Greece where the ECB was forced to do something only after markets had been well and truly spooked.) It will be a good excuse for this market to take profits. I'd be building a list of strong stocks that are coming off the recent highs as good candidates to get long. Names such as AAPL, PCLN and other names come to mind. There's also the Chinese rates thing to contend with (another excuse??) so if you are long, then tread carefully as the recent selling are clear warning shots across the bow of the current uptrend. As always though I do expect the markets to eventually bounce back and move higher given the easy monetary conditions.
Earnings play wrap up Q3 2010
Hi folks. My apologies for the lack of posts and poor notice. I just got back from holidays over in Malaysia. Anyway here is the wrap up of my earnings plays for Q3.

AAPL
2 x 290/280/260 Put BWB opened for $0.12 credit and closed for a $0.29 credit. Total return was $0.41.
2 x 360/370/290 Call BWB opened for $0.15 credit and closed for a $0.02 credit. Total return was $0.17.
Total return for AAPL was $0.68 on $9.32 of risk which gives a ROI of 7.02%

GS
4 x 150/145/135 Put BWB opened for $0.05 credit and closed for a $0.16 credit. Total return $0.21 on $4.79 of risk gives ROI of 4.38%.

GOOG
2 x 510/500/480 Put BWB opened for $0.69 credit and closed for a $0.02 debit. Total return $0.67 on $9.31 risk gives ROI of 7.2%

ESI
4 x 60/55/45 Put BWB opened for $0.13 credit and closed for a $0.49 credit. Total return $0.62 on $4.38 of risk gives ROI of 14.2%

AMZN
6 x 150/145/135 Put BWB opened for $0.41 credit and closed for $0.03 debit. Total return of $0.38 on $4.59 of risk gives ROI of 8.3%

NFLX
8 x 140/135/125 Put BWB opened for $0.62 credit and closed for $0.05 debit. Total return of $0.57 credit.
8 x 175/180/190 Call BWB opened for $0.23 credit.
Adjustment of 4 x 185/190 call vertical for $1.48 debit. (bought)
Adjustment of 4 x 185/190 call vertical for $1.64 debit. (bought)
Adjustment of 6 x 175/180 call vertical for $0.34 credit. (sold)
Adjustment of 2 x 175/180 call vertical for $0.51 credit. (sold)
Total loss of $302 on max risk of $3320 gives ROI of -9.1%.

BIDU
4 x 115/120/130 Call BWB opened for $0.16 credit.
Adjustment of 2 x 125/130 call vertical for $0.37 debit. (bought)
Adjustment of 1 x 125/130 call vertical for $0.55 debit.
Sold 3 x 115/120/125 call butterfly for $0.42 debit.
Sold 115/120/130 call BWB for $0.30 credit.
Total gain of $91 on max risk of $484 gives ROI of 4.7%.

PCLN
4 x 330/320/300 Put BWB opened for $0.55 credit.
Adjustment of 2 x 310/300 Put vertical for $0.48 debit.
Total gain of $124 on max risk of $3780 gives ROI of 3.28%.
Q3 EARNINGS PLAY SUMMARY
Total gain was $743 (not including commissions which was significant $198 and that's after I'm on a significant discount with TOS). Total return therefore was $545 and average ROI on the positive trades around 6.5% (although based on actual margin requirements, it would be only 3.25% due to current FINRA rules).
Closing remarks: The profitability versus the probability payoff seems to be right on the money here. Most of my long options were placed right at or just beyond the 1st deviation mark with my breakeven around the 2 std deviation mark (95%). Therefore I had a high probability of these trades working out for me (20:1 odds). Therefore you could say that the 6.5% ROI is about right given I had about 95% odds in my favour.
Is the effort worth the reward you might ask? Knowing that all it takes is one of these tickers to move way beyond the breakeven for all the good work to be undone. I don't know. I have the feeling that it is more hardwork than it is but in the context of the current options income trading conditions, finishing in the black on any income strategy from what I can gather is a pretty rare occurrence these days. Will I continue with this strategy into Q4? Probably given that I still some edge and there is always the off chance that I will be able to get more than a one strike separation from my long to short option and so extract greater value (hit a home run). I will probably mix it up a bit and use weekly options where I can (GOOG, GS and AAPL). Also I will not forget to add RIMM, MA and ISRG to the tickers above as these are the other ones I normally trade as well.

AAPL
2 x 290/280/260 Put BWB opened for $0.12 credit and closed for a $0.29 credit. Total return was $0.41.
2 x 360/370/290 Call BWB opened for $0.15 credit and closed for a $0.02 credit. Total return was $0.17.
Total return for AAPL was $0.68 on $9.32 of risk which gives a ROI of 7.02%

GS
4 x 150/145/135 Put BWB opened for $0.05 credit and closed for a $0.16 credit. Total return $0.21 on $4.79 of risk gives ROI of 4.38%.

GOOG
2 x 510/500/480 Put BWB opened for $0.69 credit and closed for a $0.02 debit. Total return $0.67 on $9.31 risk gives ROI of 7.2%

ESI
4 x 60/55/45 Put BWB opened for $0.13 credit and closed for a $0.49 credit. Total return $0.62 on $4.38 of risk gives ROI of 14.2%

AMZN
6 x 150/145/135 Put BWB opened for $0.41 credit and closed for $0.03 debit. Total return of $0.38 on $4.59 of risk gives ROI of 8.3%

NFLX
8 x 140/135/125 Put BWB opened for $0.62 credit and closed for $0.05 debit. Total return of $0.57 credit.
8 x 175/180/190 Call BWB opened for $0.23 credit.
Adjustment of 4 x 185/190 call vertical for $1.48 debit. (bought)
Adjustment of 4 x 185/190 call vertical for $1.64 debit. (bought)
Adjustment of 6 x 175/180 call vertical for $0.34 credit. (sold)
Adjustment of 2 x 175/180 call vertical for $0.51 credit. (sold)
Total loss of $302 on max risk of $3320 gives ROI of -9.1%.

BIDU
4 x 115/120/130 Call BWB opened for $0.16 credit.
Adjustment of 2 x 125/130 call vertical for $0.37 debit. (bought)
Adjustment of 1 x 125/130 call vertical for $0.55 debit.
Sold 3 x 115/120/125 call butterfly for $0.42 debit.
Sold 115/120/130 call BWB for $0.30 credit.
Total gain of $91 on max risk of $484 gives ROI of 4.7%.
PCLN
4 x 330/320/300 Put BWB opened for $0.55 credit.
Adjustment of 2 x 310/300 Put vertical for $0.48 debit.
Total gain of $124 on max risk of $3780 gives ROI of 3.28%.
Q3 EARNINGS PLAY SUMMARY
Total gain was $743 (not including commissions which was significant $198 and that's after I'm on a significant discount with TOS). Total return therefore was $545 and average ROI on the positive trades around 6.5% (although based on actual margin requirements, it would be only 3.25% due to current FINRA rules).
Closing remarks: The profitability versus the probability payoff seems to be right on the money here. Most of my long options were placed right at or just beyond the 1st deviation mark with my breakeven around the 2 std deviation mark (95%). Therefore I had a high probability of these trades working out for me (20:1 odds). Therefore you could say that the 6.5% ROI is about right given I had about 95% odds in my favour.
Is the effort worth the reward you might ask? Knowing that all it takes is one of these tickers to move way beyond the breakeven for all the good work to be undone. I don't know. I have the feeling that it is more hardwork than it is but in the context of the current options income trading conditions, finishing in the black on any income strategy from what I can gather is a pretty rare occurrence these days. Will I continue with this strategy into Q4? Probably given that I still some edge and there is always the off chance that I will be able to get more than a one strike separation from my long to short option and so extract greater value (hit a home run). I will probably mix it up a bit and use weekly options where I can (GOOG, GS and AAPL). Also I will not forget to add RIMM, MA and ISRG to the tickers above as these are the other ones I normally trade as well.
Monday, October 25, 2010
Friday recap
Markets just chugged sideways on Friday in what was an extremely narrow range day on the SPX. Market internals all finished mildly positive but volume came in well below average. Cumulative ticks finished at +30,000. All of this seems to suggest that perhaps momentum is stalling at this point. I'm thinking we might get some short term weakness here. Probably a days worth given buyers have been stepping in anywhere below 1170.
I am holding onto my earnings positions at the moment which are GS, ESI, NFLX, BIDU, AMZN. I will give a more detailed summary later today.
Friday, October 22, 2010
Thursday session recap
Well it seems that straight after I made that last post yesterday (after first 90 mins of yesterdays session), the market ran into some strong selling as sellers took over all the way to the close. It would appear that the a lot of people took the opportunity to sell into the morning strength judging from the fact that cumulative ticks finished at just under 0 after having peaked at +30,000. Volume was also extremely strong (30% higher than the 30 day average) especially after noon which shows heavy distribution, obviously not a good sign for the bulls. We've failed a couple of times to find buyers above the 1180 level on the SPX. In terms of market structure, failure to find any buyers up at this level again and prices could auction lower as sellers take control. Again, I don't think you should take anything for a given at this point. We could easily blow off to 1200 or we could retest 1150 on the SPX. Stay nimble and small I say!
Thursday, October 21, 2010
Thursday morning update
Internals are extremely strong today. Cumulative ticks have trended up the whole session thus far. NFLX has been on an absolute tear and my position is gaining quite a few negative deltas. However the position is up a little bit now so I will hold given that we are at all time highs and I'm still about $5 off my short strike. AMZN is also up today so that's helping my trade. ESI is showing a nice profit too having reported and the stock did not move so all that vol has collapsed which is nice. I also went for a call BWB on BIDU with strikes at 115/120/130 for $0.11 credit and got filled. This is also showing a small profit and I'm thinking that the market is pricing in a $15 move at the most, hence my long strike at $115.
Overall its a pretty good day as all 4 positions are showing a profit. Time to look for some more earnings plays for tomorrow.
Overall its a pretty good day as all 4 positions are showing a profit. Time to look for some more earnings plays for tomorrow.
No follow through...
Well one day and that was it for the bears as all those buyers that had been waiting to take advantage of decent down day came back in. Still market internals whilst quite positive did not equal the previous day's falls. Cumulative ticks finished at 30,000 after flat lining at 1pm ET. A/D lines for both the NYSE and Nas were +1500, +1000 respectively, while breadth finished at 70% for both exchanges. Volume whilst higher than the 30 day average was well down on the previous day especially in the afternoon session which is where a lot of volume was sold the day before. I think the fact that cumulative ticks were unable to maintain any sort of buying pressure/sentiment in the afternoon is probably a clue that it's not all blue skies ahead for the bulls.
I'm expecting some further weakness and so are some of the quant studies. There are also some noticeable technical divergences appearing as well so this could well be the close to the swing high of the current up leg. I'm inclined to take a few sideways to bearish positions here as well as bet that volatility will rise in the coming weeks. This fits in nicely with my theory that the market is setting itself for a buy the rumour, sell the news after the FOMC meeting announcement. It wouldn't surprise me as this has happened many times before and is common market/herd behaviour. ie people come together like lemmings all expecting some pie in the sky news and the reality doesn't quite match expectations (after all no one knows how much the Fed is going to expand its balance sheet if at all).
On the trade front, I jumped into NFLX yesterday as well. I bought two BWB's, one on the call side and one on the put side. On the puts I bought the Nov 140/135/125 for $0.60 credit and on the calls I bought the 175/180/190 for $0.23 credit. NFLX reported last night and jumped from $153 to $164 after market. Interesting given the straddle was priced at around $22. I'm now in a decent position on this trade if NFLX continues its upward climb. I'm really starting to get a feel for these earnings plays on volatility skew and I'm going to refine my strategy somewhat with my strike selections. I have BIDU on my radar as potential candidate tonight and so will test it out on that. Given my sideways to bearish view I'm thinking of selling some call spreads on one of the major indexes depending on which one is overpriced. Buying some units here is also not a bad idea. More later........
Also some good posts on other blogs. One here from Corey at Afraid to Trade and one from Babak at Trader's Narrative.
Wednesday, October 20, 2010
Tuesday Recap & Quant predictions
NYSE breadth finished at 10.5% with the Nas doing a bit better at about 18%. A/D lines were both very weak on both with sub 2000 on the NYSE and sub 1800 on the Nas (Anything above and below 2000 and 1800 can be considered extreme on both exchanges). Volume was extremely heavy yesterday coming in well above the 30 day media. Cumulative ticks finished at -50,000 which in the overall scheme of things can be considered not that bad given we've seen negative ticks of greater than -80,000 before. Thus some of the quant studies are showing a short term bounce after yesterday's session. Other seasonal studies still showing further weakness for the rest of this week. However most of the other studies still favor stronger prices in the intermediate term time frame (1-3 months out). I'm still inclined to agree. Babak from Trader's narrative does a terrific job of summing up some of the reasons why here.
As for my current positions. I tried to exit the AAPL position not long after the open as the tape action shows there remains a lot of people who are willing to get long this stock in response to the gap down. No point holding $4000 in margin on this play when my fly is unlikely to finish in the money at this point. Overall a small profit but I'll take nonetheless. The GS position is also showing a small profit and likewise the ESI position. I will probably try to exit the GS position fairly as I don't expect much weakness in it given its positive reaction to earnings and what happened to the broader market last night. For ESI I will hold through earnings.
I also entered into an AMZN Nov Put BWB for a credit of $0.41. Strikes are 150/145/135. Showing a small loss at the moment. AMZN reports tomorrow after market. I will be holding this through earnings as well.
Tuesday, October 19, 2010
Monday Recap & Tuesday Predictions
Well the market again finished higher. There was some strong afternoon buying and all market internals were positive, with cumulative ticks finishing up +35,000, A/D lines at about +700 for both exchanges and breadth was 70% and 55% for the NYSE and Nas respectively.
Again, the quant predictions are for lower prices given that the indices have finished stronger largely on the back of a few big cap names like AAPL which makes up 21% of the NDX finishing higher. Given that AAPL got whacked somewhat after hours due to lower than expected earnings, we may finally get the sell off that people have been waiting for. IBM also missed so those two names are weighing down the nasdaq futures which are down 1%. It’s a mixed bag with the ES only down 0.5% and the Dow only down 0.1%. Fairly strong considering that tech is being hit. We’ll see if correlations increase as the cash opens but things are kinda of interesting right now.
Tradewise, the positions are going fairly well. I suspect my AAPL BWB will do quite well with the drop in implied vols. Also ESI is staging a comeback which has put the trade up a little bit. Same story for GS which reports this morning.
Oh I'm also looking at another earnings trade on AMZN. I'm liking the 155/150/140 Put BWB for $0.45 credit.
Monday, October 18, 2010
Market makes a fool of everyone again!
Well we had weaker than expected production numbers and the market is up! Go figure....Perhaps it was further confirmation that the Fed will embark on QE2 when they meet next month and the market likes that? Well bonds are up today so you can write your own story about it. All the quants studies were pointing to limited upside and more downside. It's early days yet so we could still end up with this scenario. Market internals have come off the highs.
I was looking at AAPL before and noticed that the skew on it is incredibly high. I decided to enter into another BWB but this time to the upside so I bought the 360/370/390 Call BWB for $0.14 credit. Again too hasty with the entry as it is trading more around $0.23. It should be an interesting after market when AAPL reports. I'm expecting better than expected earnings but AAPL is already up around 5% since last week on anticipation. Could it really climb another 10-15%??
I was looking at AAPL before and noticed that the skew on it is incredibly high. I decided to enter into another BWB but this time to the upside so I bought the 360/370/390 Call BWB for $0.14 credit. Again too hasty with the entry as it is trading more around $0.23. It should be an interesting after market when AAPL reports. I'm expecting better than expected earnings but AAPL is already up around 5% since last week on anticipation. Could it really climb another 10-15%??
Monday predictions
Well the combination of weak breadth and slightly flat finish for most of the indices seems to have triggered some bearish signals for this week as mentioned by my quant subscriptions. Cumulative ticks trended lower all day and finished at -50,000 and volume was very strong on Friday if that is any guide.
Treasuries also got hammered last week so I'm not sure if that is another sign. Not sure if Big Ben's plan is going to work either. The Fed wants higher inflation and will surely get it but at what cost? Surely no one will want to buy UST's and the Fed will not just be the marginal buyer but the only buyer before too long. What happens then, they just keep buying the stuff and the USD becomes worthless? Is this an indirect shot at getting the Chinese to re-value the Yuan? Besides who benefits from higher inflation? The thinking is that this is so businesses can regain pricing power and increase the prices of goods to the consumer? Nice theory but they forget that the consumer is all tapped out and have too much debt. How can you possibly keep spending money you don't have? It's not like the Fed is giving us the money they are printing. Nope that's going to the US government to fund their liabilities which they can't meet by the way. Perhaps that is the real reason then??
Well given that the BOJ, the ECB and the BOE are all going to do it in one form or another it appears that the secular trend of all fiat currencies are going to become worthless. Gold to $2000 an ounce then?? Maybe.....at the rate we are going.....
Friday, October 15, 2010
Friday morning update
Hmmm.....sitting in front of my trading computer for the first time in a while, whilst the market is open. Maybe getting a bit itchy with the trigger finger having not traded "live" like this for a while so here's what I've done. I don't like the sell off in the long bond of late (perhaps traders are now betting the Fed purchase of treasuries won't be as much or the Fed won't buy at all!) but I've closed out my short put position. This only leaves me with the short call spread which I'm trying to close also. I've also entered into the ESI trade I wrote about earlier but for $0.13 credit (I was a bit hasty on this as you should be able to get filled for $0.23 or thereabouts). Also I just realised that ESI has earnings next week as well. Therefore I'm taking quite a gamble as the market is pricing in a hefty move and my breakeven is at $50.
As for the GOOG trade, it's pretty much trading at around even and I've got an order to close at $0.02 debit.
Market internals looking decidedly weak. Breadth and A/D lines are all trending down with the exception of Nasdaq breadth. Meanwhile cumulative ticks are trending straight down too. Interesting. Is this the pullback everyone's been waiting for?? Was the big move on Wednesday the blow off top?? VIX is back above 20 today.
Thursday session recap
It's interesting to note that volume was quite heavy yesterday and well above the 30 day median average. However we do have to keep in mind that it is OpEx week after all. Cumulative ticks finished squarely negative settling in at -30,000. Other market internals were weak as well but nothing to panic about for the bulls. I've been reading some research that suggests we could be in for a mild pull back next week based on seasonal factors. At this stage I don't think we are going to see any sustained large moves before the FOMC meeting. Market seems to be treading water and no one really wants to show their hand just yet. I think there's more than a few people just positioning themselves ahead of the meeting. Interesting that treasuries are selling off a bit. Perhaps there is a whisper that the Fed will not be buying as much as people expect? Maybe stocks will follow the path of treasuries?
As a side note, I'm looking at an opportunistic play on ESI. It got hammered along with a lot of other education stocks yesterday. Looking at selling some vol here and anticipating that it will fill the gap in a month or so. Looking at using the 60/55/45 November Put BWB trading for around $0.28 credit.
As a side note, I'm looking at an opportunistic play on ESI. It got hammered along with a lot of other education stocks yesterday. Looking at selling some vol here and anticipating that it will fill the gap in a month or so. Looking at using the 60/55/45 November Put BWB trading for around $0.28 credit.
3rd quarter earnings play update
Ok, so I may have been a bit impatient with these trades as all of them got filled! On the GOOG trade, I got filled at $0.69 and with GOOG trading at 590 after market, this spread is likely to be trading around even which means I get to keep the measly credit. Nevertheless 3.45% ROI in a day ain't bad. It would be more if the dim witted folks at FINRA changed the margin rules on the BWB so that brokers would stop charging me double of what I can possibly lose! I will close out this trade today.
The other trades I got filled on was an AAPL Put BWB with strikes 290/280/260 for $0.13 credit and GS Put BWB with strikes at 150/145/135 for $0.05 credit. Both of these along with the GOOG are smallish positions. The plan here is to hold them through earnings and exit at anytime I can get 5-10%. Ideally what I'm hoping for is for a small downside surprise after earnings. You will notice that my breakevens on both trades are pretty conservative ($270 for AAPL and $140 for GS). I think the market prices the earnings moves pretty efficiently most of the time. For example with GOOG the at the money straddle price was around $40. So $40 plus $540 gives $580 but GOOG did do much better than expectations which is why it is at $590. For AAPL, the straddle price is around $23 which means the odds of AAPL gapping more than this is pretty low. Anyhow my sweet spot is right on the 280 mark so a move similar to this would be nice. Ditto for GS where the November straddle is priced at $11.
The other trades I got filled on was an AAPL Put BWB with strikes 290/280/260 for $0.13 credit and GS Put BWB with strikes at 150/145/135 for $0.05 credit. Both of these along with the GOOG are smallish positions. The plan here is to hold them through earnings and exit at anytime I can get 5-10%. Ideally what I'm hoping for is for a small downside surprise after earnings. You will notice that my breakevens on both trades are pretty conservative ($270 for AAPL and $140 for GS). I think the market prices the earnings moves pretty efficiently most of the time. For example with GOOG the at the money straddle price was around $40. So $40 plus $540 gives $580 but GOOG did do much better than expectations which is why it is at $590. For AAPL, the straddle price is around $23 which means the odds of AAPL gapping more than this is pretty low. Anyhow my sweet spot is right on the 280 mark so a move similar to this would be nice. Ditto for GS where the November straddle is priced at $11.
3rd Quarter earnings plays
Trying to get some BWB's on AAPL, GOOG and GS filled but with no luck. Going for put BWB's that are a few strikes out of the money. For example, I'm trying to get filled on a GOOG November put BWB with the strikes at 510/500/480 for around $0.70 credit.
Overall I'm bullish here on these names and even with a slight sell off I expect them to hold up pretty well. I just want to sell some volatility skew here if I can.
Overall I'm bullish here on these names and even with a slight sell off I expect them to hold up pretty well. I just want to sell some volatility skew here if I can.
ZB Nov Iron Condor

Market summary
Some notable observations of late:
- Whilst market closed higher yesterday, cumulative ticks finished sharply lower a sign of institutional selling. No surprise we are bit weaker today.
- Lots of intermediate term signals have triggered according to my quants including new highs versus new lows, the major indices at multi month highs and some strong cumulative tick readings (ie +70,000 just last Friday when the market finished flat to down).
- Volatility is getting crushed. VIX versus VXV ratio is below certain bearish thresholds in the past. A low VIX to VXV ratio implies that the market is pricing higher volatility in the future (short term versus long term view of volatility)
- CBOE put to call ratios getting very low (below 0.60). A symptom of the overall bullishness of this market.
Overall, the signs are there that the market is getting complacent and it has definitely priced in some type of QE2 from the Fed. The big question is how much? It could be a case of buy the rumour sell the fact as we get closer to the next Fed meeting on November 2nd to 3rd so keep those dates handy.
Lots of market participants are expecting some sort of a correction/pullback here. I don't think this will happen probably till after the FOMC meeting so I'm expecting a 3-5% pullback in early November. I think there is a very good chance given the pervasive bullishness that the market will bounce back strongly from any sell off as there is probably a majority of people out there waiting to buy the first real dip. I think a run up to retest the April highs is now well on the cards. After that who knows but one thing is for sure, this market is being conditioned or forced to be bought by virtue of the fact that as far as alternatives go, there is no where else to park your money especially when the central banks are hell bent on creating some kind of asset inflation. We would need some type of geopolitical event such as another sovereign debt crisis to spark some real selling in this market. Funny how we haven't really heard anything more about this in the media even though the underlying problems still exist. Anyway that's how the herd mentality of investors go. Out of sight, out of mind.
My best bet and plan is to sell volatility and go long deltas on any decent sell off. Not a bad idea to buy some cheap call spreads here either.
My best bet and plan is to sell volatility and go long deltas on any decent sell off. Not a bad idea to buy some cheap call spreads here either.
Thursday, October 7, 2010
Earnings Tickers that I'm keeping a watch on
I like AAPL, GS, GOOG, AMZN, RIMM, PCLN and possibly a few others............
Fed intervention??
Here is a great and very interesting post about the statistical effects of the Fed's Permanent Open Market Operations (POMO). Hats off to Rennie Yang from market tells for bringing it to my attention. Also many thanks to Frank over at Trading the odds blog. You will note that this is one of the blogs on my blog roll.
Well the article is a bit long and there is some statistical jargon but the conclusion is that when the Fed intervenes in the markets within a cluster of dates, stock market returns have been skewed to the upside.
Also note that the last time there was a cluster of these POMOs was back in March to October 2009.
Well the article is a bit long and there is some statistical jargon but the conclusion is that when the Fed intervenes in the markets within a cluster of dates, stock market returns have been skewed to the upside.
Here are the dates of the POMO operations
I think it's safe to conclude that you cannot fight the Fed! Also I wouldn't be surprised about how much front running goes on at all the major trading institutions when the Fed announces these kind of actions/dates. As a side note, I'm currently reading Liar's Poker by Michael Lewis. I'd highly recommend it for a really funny and realistic insight into the culture of the institutional trading world and how it operates. Hard to believe that the securitization of mortgages occurred way back in the 1980's (one of the main causes of the GFC)!
I would also keep the date of Nov 2-3 in mind as that is the next FOMC meeting and where everyone largely expects that the Fed will announce further expansion of its balance sheet (QE2). I would be weary of holding large positions in both bonds and stocks prior to this as a shock announcement (no QE2) could create some big volatility. I think it's fair to say though that the markets are pricing in another round of central bank stimulus. As a trader we should be thinking further ahead of the next wave. Most likely a big run up in gold as fiat currencies get devalued?? Also commodities look like a good inflation play. I think it's becoming increasingly evident that at some stage all this liquidity is going to drive the next boom. We here in Oz are already feeling the pinch because our central bank has hinted at raising rates in the near future and interest are already at 4.5%!!!
Safe trading everyone.
Tuesday, October 5, 2010
Earnings season just around the corner
First up markets finished lower and internals finished weaker but cumulative ticks managed to hold at 12pm and trend sideways the rest of the day finishing at -25,000 which can be considered insignificant.
Just a note that earnings season kicks off soon with Alcoa this Thursday so I'll be looking at doing some earnings plays mainly taking advantage of the skew that develops in the options of earnings companies. I'll post a few dates with some possible candidates in my next post.
Just a note that earnings season kicks off soon with Alcoa this Thursday so I'll be looking at doing some earnings plays mainly taking advantage of the skew that develops in the options of earnings companies. I'll post a few dates with some possible candidates in my next post.
Monday, October 4, 2010
Morning trade...
Heads up, cumulative ticks are trending sharply lower in the past 45 minutes. Volume is extremely low though so this may be another bout of profit taking before the next leg up. All the studies and commentary from all around the web suggests more upside to this market. Right now the market is struggling to clear the 1150 on the SPX. Perhaps today's action will suck in some more bears before we get a gap and go situation that will finally give us the thrust higher?? Who knows.....
At this point in time, I did manage to leg into my ZB iron condor with short put spreads at 126/123 and short call spreads at 141/144. All done for a credit of $3937 on $14062 of risk. At this point in time the trade is up $473. I'm thinking of buying insurance on both sides here as I'm fearing a big move sometime further out. This market just seems a bit docile to me and I just don't trust it given what's transpired over the last 24 months. I'm betting volatility will rise at some stage......(you don't have to be a genius to make that statement!)
At this point in time, I did manage to leg into my ZB iron condor with short put spreads at 126/123 and short call spreads at 141/144. All done for a credit of $3937 on $14062 of risk. At this point in time the trade is up $473. I'm thinking of buying insurance on both sides here as I'm fearing a big move sometime further out. This market just seems a bit docile to me and I just don't trust it given what's transpired over the last 24 months. I'm betting volatility will rise at some stage......(you don't have to be a genius to make that statement!)
Wednesday, September 29, 2010
Current thoughts
Still no positions at this point although I am trying to leg into an November iron condor on the long bond with 126/123 strikes for the puts and 142/145 strikes for the calls. I've been trying to leg into the put side first with the view that bonds are likely to move a bit higher. Alas I may have missed the boat because bonds found a floor at 132 and have not looked back since.
Interesting that the SPX and the VIX both moved higher yesterday. Normally this is a short term bearish signal. Cumulative tick action was mixed last night finishing at minus -6000. Recent action has been fairly bullish with the 70,000 mark hit when the Dow finished up 175 points last Friday.
The current market action to me suggests that the market is pretty much anticipating another round of quantitative easing from the Fed as a floor under the market. We've seen risk appetite go through the roof with small caps and tech leading the equity rally whilst, yield currencies like the AUD hit multiyear highs against the greenback. Gold is also up sharply. Meanwhile bonds have not fallen sharply like you would expect when risk taking is up so that's saying something.
Stay tuned for more.......
Thursday, September 23, 2010
I'm still here!!
It's been a bit quiet on the blog lately as I've really nothing to report as the market keeps grinding it's way higher. Look for the 1150 on the SPX as a possible swing high. I only have the one position on right now and that is a short put spread on the long bond which I'm trying to close. Overall the iron condor has returned around 45% on the margin held which is pretty good. I'll update this trade later in the week.
Wednesday, September 15, 2010
Thinking out aloud
I think the market is just setting itself to be disappointed if the Fed does not announce any new quantitative easing measures on the 21st of September. I think that's why we've had the rally and why the USD has been slaughtered of late and gold is rallying. Methinks that the current swing high in this rally is not too far off. Now what would be the best trade to profit from this if I was right??
Tuesday, September 14, 2010
Big divergence this morning
I'm seeing big divergence between the ticks and the other internals. Cumulative and adjusted ticks are trending straight down but breadth and A/D lines are coming in very strong. I always use the ticks as an leading indicator as it foretells that institutions remain the better sellers today. Perhaps a reversal is not too far off as the market has been amazingly strong (eg. 6 upside gaps in a row that have not filled now - this has not happened before). I think what we have witnessed was short covering rally that has fuelled this market. For us to remain bullish in the longer term, I'd have to see if it can take out 1150 on the ES.
Tuesday, September 7, 2010
Morning update
Cumulative ticks are levelling off here and bottoming after trending straight down for the first 30 mins today. Other internals also bottoming out. Volume is very weak today. I'm expecting some kind of afternoon rally here but the market is very overbought so I wouldn't be surprised if we just go sideways and chop it up for the rest of the day.
On the trade front, all is well with the long bond iron condor and the NDX iron condor. I'm not seeing any other opportunities at this point so it's a matter of waiting for something more substantial to happen. With the pop in volatility today, I don't think selling some is such a bad idea.
On the trade front, all is well with the long bond iron condor and the NDX iron condor. I'm not seeing any other opportunities at this point so it's a matter of waiting for something more substantial to happen. With the pop in volatility today, I don't think selling some is such a bad idea.
Wednesday, September 1, 2010
Uber bullish
Everything is green today! Under the hood the internals are flying. It's like someone put a rocket under this market. Ticks are just trending straight up and volume is on par with yesterday ie very strong and well above the 30 day median average. I'm not sure why the market would be rallying so hard but could it have been to do with China's PMI today which came in slightly above expectations?? Futures opened with quite a large gap up and well above yesterday's highs and this normally forces a lot of the shorts to cover. It is also the first day of the month, which is normally when a lot of new money coming into the market gets invested. I'm expecting a strong close near the end of the day as well from the dumbo's that tried to fade today's gap ie as they have to cover their positions (first day of the month and large gaps are statistically very poor winners for fading gaps - learnt that from masterthegap.com)
Are we going to make a run at 1120 from here??
Are we going to make a run at 1120 from here??
Tuesday, August 31, 2010
Heads up.....
Extremely high volume today. I am seeing volume come in about 30% above the 30 day median on the SPY. The next question is why?? Is the market really loving the housing and consumer confidence numbers today? Note that we have bounced off the 1037 level on the ES for the 5th time now. Ticks continuing to trend higher so we should finish firmly positive I think today.
ZB Oct Iron Condor

The risk graph above is my current position on the ZB. I'm still bullish overall on bonds which is why I adjusted the position today by embedding a long call spread within it.
OEX BWB Put Update
A few adjustments here. I decided to hedge my original position a bit by buying the same number of the 475/470/460 OEX Put BWB expiring this week for $0.25 credit. I also reduced by half my original position by selling them out for $0.60 debit for a loss of $0.60 per contract. I did all of this before the consumer confidence number and I can tell you that I got filled on the hedge position almost instantly. I guess the market makers thought that we had a good chance of going lower with a bad number. I might add that when you get filled instantly, that's not a very good sign as it means the market is more than likely about to move against you (those market makers know just a bit more than me. I lie, they know a lot more than me!). It would appear that even though we've had nice bounce off the number, the way they are still pricing the spreads is telling me that there is still a chance that the market could sell off this week. Under the hood we have cumulative ticks now positive and all other internals improving quite considerably.
Below is the adjusted position on the OEX BWB. Please note that the P&L is incorrect. Overall I'm still down about $200 in the trade.
 However with the adjustment, I feel a bit more comfortable as I've given myself more downside movement should we get it this week. One of the main reasons I adjusted was that the market has failed to rally. The rally which I was expecting was the reason why I put the trade on in the first trade (last Friday). Thus when the market fails to do what I thought it would then I always re-evaluate and either adjust or get out of the trade entirely. One needs to be proactive not reactive when trading the current market. No need to be forced to adjust when you absolutely have to ie when the trade is already a clear loser....

That is an F!
Yes that's the mark I'd give the market after yesterday's session. The rally failed miserably after just one day. It kinda tells you what kind of mood the market is in. Under the hood we had cumulative ticks finish at -70,000, A/D lines both at very bearish levels (-1700 on the NYSE and -1600 on the Nas) and breadth on the NYSE was 10% positive while on the Nas it was not much better coming in at 17% positive. The only saving grace was that volume was very light but that's probably because it was a banking holiday yesterday in the U.S.
That leaves us in a very precarious position as the ES is now just a mere 4 points or about 0.5% from taking out last week's lows. You can bet that there are a lot of stops placed just below this level, so any trading below that and we will likely test 1010 again. At this point in time, I'd be wary of placing any new trades and wait for the market to make it's move first. I'm looking to adjust my OEX BWB just in case we roll over hard here.
That leaves us in a very precarious position as the ES is now just a mere 4 points or about 0.5% from taking out last week's lows. You can bet that there are a lot of stops placed just below this level, so any trading below that and we will likely test 1010 again. At this point in time, I'd be wary of placing any new trades and wait for the market to make it's move first. I'm looking to adjust my OEX BWB just in case we roll over hard here.
Monday, August 30, 2010
Was Friday's rally for real?
Well it would appear that the market got a real boost from Bernanke's comments about doing everything it can to help the economy. Let's look at the facts from Friday's session. A/D lines on both the NYSE and Nasdaq were at extremely bullish levels. Breadth on both exchanges were above 90% whilst cumulative ticks finished at a healthy 50,000 ticks after starting off down -10,000. Volume was quite heavy finishing well above the 30 day median average.
So what do I think of the market here? I think Friday's session was a bit of a knee jerk reaction to the Fed's comments. I don't think anyone want's to get their pants pulled down in case some unexpected new measure is announced so it was a case of a lot of traders covering their positions and probably a few new longs getting into the market. The danger here for the bulls is that the market fails to make any sort of meaningful bounce. A quick failure here would lead to a lot of disappointment and that could lead to a lot of long positions being dumped quickly. That would be perfect for new shorts and so we could see heightened volatility (on the way down). We shall see.
I did initiate a smallish OEX Put BWB with 480/475/465 strikes but now after thinking through the structure of the market above, I'm not so confident as if we fail to rally here then we could move lower within a short space of time so I need to monitor this trade closely.
The update on the same trade but that expired last week was that it was closed for $1.00 credit. It may have done a lot better had Ben not opened his mouth but that's trading for you.
Thursday, August 26, 2010
Another forgettable session it seems....
Internals were strong off the open and started trending up but have now started pulling back. NASDAQ is looking decidedly weak right now. Breadth is actually negative on the NAS. Volume is average and on par with the 30 day median but no where close to like it was yesterday when it was very strong. Overall it looks like we are in for another chop session. I'm not sure when we will get some nice movement and opportunity but it feels like everyone is on vacation.
My trades are looking dandy right now. The OEX put BWB is doing quite nicely and so is my iron condor on the NDX and SPX. I've got capital to deploy but I'm going to wait until the market actually does something! Yep, I'm going to be much more patient, and disciplined as to when and what I trade. I think that's the best way to approach things from now on. Take what the market gives. This is how I used to trade a while back and I think with the uncertainty surrounding the current market you need to try and get as much edge as you can.
My trades are looking dandy right now. The OEX put BWB is doing quite nicely and so is my iron condor on the NDX and SPX. I've got capital to deploy but I'm going to wait until the market actually does something! Yep, I'm going to be much more patient, and disciplined as to when and what I trade. I think that's the best way to approach things from now on. Take what the market gives. This is how I used to trade a while back and I think with the uncertainty surrounding the current market you need to try and get as much edge as you can.
Wednesday, August 25, 2010
Chop, chop....
I think the market is going to consolidate at these levels. Market internals today, whilst they were weak right off the open have now stabilised and are bouncing. Just in case you didn't know cumulative ticks finished only down 10,000 yesterday so it's not like the selling is accelerating but then again, it's not like the buyers are stepping in either. Overall a choppy sideways market. I'm leaning slightly on a bit of a bounce so with that in mind I put in a small 2 contract position on the OEX with a 480/475/465 Put BWB. I got filled for even. We'll see how we go. Market overall feels dead to me here, I don't think there's any real sellers or buyers left anymore. Also, I think for us to have any meaningful bounce, it's going to take some sort of a shakedown to get rid of all the weak hands that are still long ie we have to go lower to go higher. Risk is firmly off at this stage judging by a check of all the asset classes out there.
Tuesday, August 24, 2010
Existing home sales nose dive......
Well the market is acting kind of strange today. Breadth has been trending lower the whole morning and A/D lines are quite bearish. However the odd thing is, is that the cumulative ticks bounced right on the release of the worse than expected housing number. Meanwhile, breadth and A/D lines have improved somewhat. Perhaps some bottom fishing going on here after 3 days of weakness?? Nice big bottoming tail on all the major indices so it seems that 1040 or thereabouts on the SPX are where buyers are willing to step in. Volume is huge today so that's another clue that perhaps the "other" timeframe buyer is stepping in.
Monday, August 23, 2010
Where to next?
I'm seeing some dark clouds on the horizon just judging from the recent price action. In the intermediate to longer term time frame I think the markets will have a higher chance of moving lower. Just the economic data points coming in seem to suggest that the government and central bank induced pop in growth is now over and we are seeing very sluggish growth rates. Still there are a lot of companies that are flush with cash and you seeing evidence of this in the form of takeovers and buyouts recently. Thus this should be supportive of equity prices and valuations.
I remain in the range trading camp but we could see the SPX trade back down in the 1010 to 1070 range.
I remain in the range trading camp but we could see the SPX trade back down in the 1010 to 1070 range.
August Trading Review
Hmmm....I've broken a few promises of late, one of which was to update my August trades. Yes my integrity is a bit out so let's right the ship by going back over my August trades. Overall August was a bad month with the account down 8% but it could have been worse as I was down over 17% at one stage. Let's go over the good, the bad and the ugly.
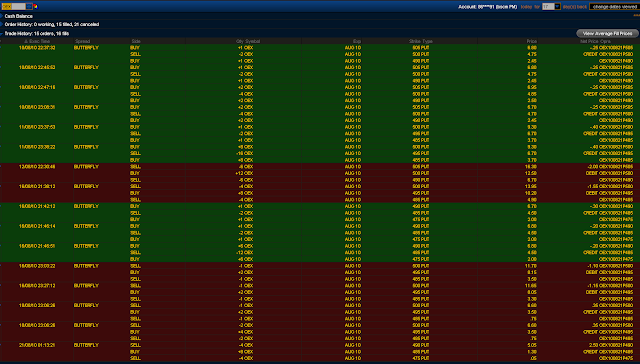
The Good - The only good thing to happen during August was the 2nd lot of hedge trades I had on the OEX Put BWB's for August expiration. If you've been following the blog closely, you will remember that I initially had bought 6 x 505/500/490 Put BWB's (see above) for $0.25 credit. But then after the big down move, I decided to double down and buy some more but at 500/495/485 for $0.40 credit (you can backtest the trades by following the dates and times but note that they are in GMT +8). When the markets failed to bounce I had to get out of the original 505/500/490 BWB's for $2.00 debit (a big loss of $1.75 per contract). Then as the market just kind of went sideways, I thought it was probably a good idea to start peeling off some risk and get out of some of those 500/495/485 BWB's as well by taking some off for $1.55 debit (a further loss of $1.15 per contract) and a couple of other contracts off for $1.10 debit. As I was taking the risk off I bought some more BWB's lower down with the 490/485/475 for $0.25 credit (average). All up I bought 8 contracts. At this point I had 8 of the 490's and about 3 of the 500's left. Now as the markets bounced last Wednesday (see OEX chart below) I was able to take the remaining 500's off for $0.35 credit (profit of $0.75 per contract). At this stage I decided to hold onto the 490's as they were in profit and out of the money but I was expecting some bearish action on Thursday and Friday. Lo and behold, I was right for once and the market moved lower. So on Friday mid morning I took 4 off for $2.50 per contract and decided to let the 4 ride as I didn't think we would have any big moves on Op Ex day and the market internals were holding firm and going sideways. The OEX finished up at $486 resulting in a payout of around $4.00 for the remaining 4 contracts (profit of $4.20). I haven't done the maths yet but when you add up all of those trades I think I might have come out slightly ahead. It was really one of those rare instances when the market cooperates for you and you get the underlying to finish almost dead on your short strike.

The bad - The iron condor on the zb trade for August took a big hit. When the markets tanked, bonds rallied like crazy and as I was short the 131/133 August call spread, you can imagine I took some heavy losses as I was too slow to react. The list of adjustments to my position is as follows:

Notice I started buying OTM call butterflies to move my breakeven higher. However as bonds continued to rally I eventually had no choice but to buy a bunch of the short 131/133 call spreads back and roll my put spreads up as well.
The risk graph now looks like this:
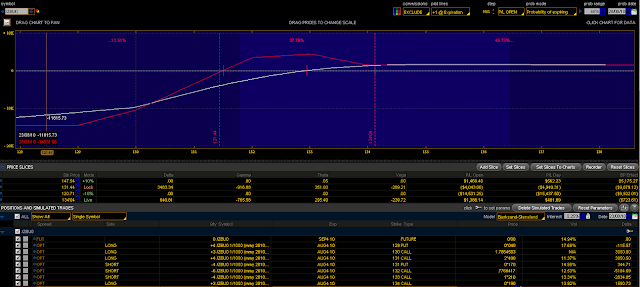
The position has probably made most of it's money right now unless bonds sell off which I think is unlikely. I will probably leave the position on just in case they do decide to pull back a bit. Overall this position has taken off about 5% of my total account in August.
The Ugly - Well the stinker of the month has to be the OTM NDX call butterfly I decided to buy one day before the SPX lost 2.8%. You can see the trade plus the adjustment's below:

This trade was where I lost the other 4% of my account. Say no more.......
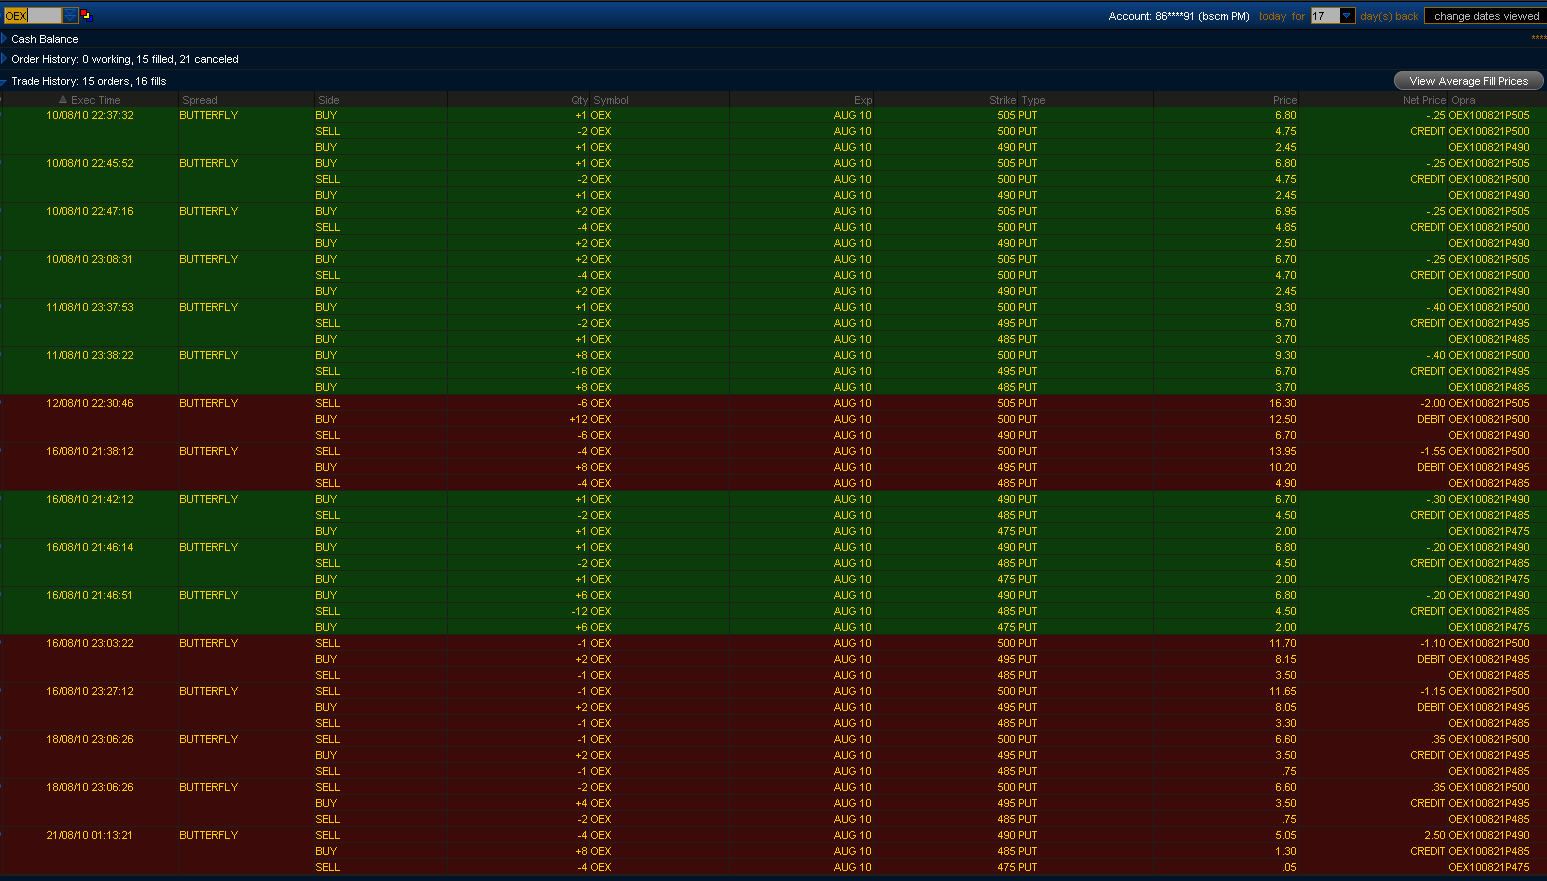
Thursday, August 19, 2010
Watch out below!!
Cumulative ticks are trending straight down! Volume is huge today! Looks like a trending day to me and things could get ugly!! Take care out there!
Wednesday, August 18, 2010
Yes I'm still here!
Ok I'm back from my blogging hiatus. I had to complete a financial analysis assignment due yesterday. I know it sounds like fun but in reality it was heavy going. At least I learnt a few things such as how to analyse financial statements but don't worry I will not be applying what I learnt on this blog (not yet anyways).
Right, back to the markets and in both Monday's and Tuesday's session we had positive 60,000 cumulative ticks. A/D lines and breadth were very positive on Tuesday but somewhat mixed on Monday. Overall Monday's positive ticks should have been a clue that selling power was drying up and we would bounce which we have done so. Volume has been reasonable but still coming in somewhat below average. At this point, the market is likely to consolidate. I think it's still hard to say which way it's going to break but until it does break this narrow range of 1120 to 1070 on the ES, positions should be kept fairly light. I'm just not in love with the idea of intiating income trades at this point because the market could move.
Trade wise, I've taken a pounding over the last week. I've had to adjust my OEX Put BWB twice, I've had to buy back my short bond call spreads as well as adjusting (have they moved or what??!!) and I completely exited my NDX position (last Thursday of course). Overall, I think I really need to cut down the amount of time I'm actually in this market and just be more patient and discipline and wait for the opportunities like last Wednesday and Thursday. The payoff structure for income trades just isn't worth it at the moment (ie you make 1 but lose 8 if the market moves against you). I'd rather play something more symettrical like the e-mini futures if you want to trade day in day out or actually spend a little and buy some premium (long gamma, short theta) to take advantage of the sharp movement in either direction.
Well more on this later and I will post snapshots of my trades later tonight (Perth time).
Thursday, August 12, 2010
And the verdict is............
Pretty bad session for the bulls (me included). It was a stinker every way you look at it. Cumlative ticks finished at -140,000, volume surged well above the 30 day average, breadth was terrible coming in at about 30 to 1 negative, yup that's not an error, that is a shocking number folks. A/D lines were just as bad with sub minus 2000 readings on both the NYSE and Nasdaq. I haven't worked out what the skew is but if skew didn't go up too much then that would be a victory for the bulls as it tells me that the selling whilst bad was expected or orderly unlike the type of panic selling that occurs when something unexpected comes up. Remember the VIX did go up on Monday along with the market so that in itself tells you that some of the smart money was already hedging bets (usually a bearish sign according to my quants).
Needless to say, all my positions got absolutely smoked last night. The NDX position right off the get go was down 50% on a cost basis due to the large gap (ah the perils of holding overnight positions in this market) and this was after I was up 10% at the close of yesterday! This is bad and as bad as it was, sometimes there is nothing to do in that situation except not to panic and wait for the reversal. I made some adjustments to it with the advice of Mark but the position is on life support barring a 2% rally before next week's expiration. I will post a risk graph of it tonight.
The other trade is the OEX BWB and early on in the session, I made the decision to double down and hedge the position by buying more of the BWB with strikes further down (500/495/485). What this does is increase my expiration breakeven but adds more deltas, short vega and long theta to the position. So ideally I need the market to hold at these levels or if it sells off a bit more proceeded by some kind of bounce at the end of it. The lucky thing is is that I have some time on my hands for this to eventuate unlike if I was in the weekly options that expire this Friday (there would be very few options left but to get out).
The final trade is the iron condor on the long bond ZB. That position is also on fire as in going down in flames with the long bond now slightly past the short strike calls at 131 (oh how I regret to go against my long term view that bonds were a good long play). I am doing nothing at the moment on this position either until it reverses somewhat before adjusting (if I do). This is the same as the NDX position, what I've learnt over the years is that adjustments shouldn't be made at the worst time (emotional pain is the highest but when things are calmer). If I had traded based on my emotions, I would no longer be here. It takes a bit of a iron stomach to trade like this but that is my trading philosophy and plan and I'm sticking to it. Remember the market doesn't pay you for being comfortable but for when you are very uncomfortable as many times it's the contrarians type of approach that pays off.
So what next? Well, as bad as it was, I think I've seen this movie before. ie market rallies and then sells off very hard over 2 or 3 days before it bottoms and then rebounds sharply. I think in the very short term we probably will bounce here. However, in the intermediate term context, it does call into question of whether we will get higher prices. This market has such a short term memory it wouldn't surprise me but then again you never know. Overall it would appear that the wide range trading scenario is playing out nicely ie support at 1010 and resistance at 1120 on the SPX. We shall see........
Wednesday, August 11, 2010
Pre-market thoughts
As I write this, the market is taking it on the chin with the futures down over 1.5%. I think the reaction across the globe today was two fold.
1) I think there was a little disappointment that the Fed didn't come out and do more. After all it's what it is basically doing is keeping the size of its balance sheet at these levels instead of allowing it to shrink slowly. The market was probably expecting more QE and a further expansion of the balance sheet.
2) The economic data that came out of Japan and China was worse than expected signalling a slowdown in those two economies.
Combine those two points and you could say that the Fed is behind the curve?? It remains to be seen whether this sell off develops into something more nasty but I suspect buyers will come back in a lower levels just because you've got nowhere else to put your money ie property still stinks & bank deposits are paying nothing these days because of the record low yields. Therefore even though you know the global economy ain't going that well, and all three choices are bad, its like choosing the not so bad option.
We'll see in the first hour just how bad things are, when we get to look at the internals underneath today's price action. If the institutions really didn't like what they are seeing from those two points above then you would expect extremely heavy volume and very lopsided breadth and tick action (-100,000) at the end of today's trade.
My money is that there will be buyers and this is not the beginning of a new down leg. We need something a bit more dramatic than a few bad data points for the markets to totally reprice risk. What's more likely to happen is that we might trade between 1080 and 1120.
Tuesday, August 10, 2010
Trade update
Just got filled on some of the OEX Aug 10 put BWB's at 505/500/490 for $0.25 credit. Ticks are holding firm at -10,000 (not super bearish) and breadth seems to have found a bottom here. Volume is starting to drop off so if the markets can hold here which it looks like it will then I'd say it's a good entry point for a short term long trade.
I also went long a NDX August call butterfly 1875/1925/1975. Let's see how it plays out.
I also went long a NDX August call butterfly 1875/1925/1975. Let's see how it plays out.
Morning update
Breadth continues to trend lower at this stage. Cumulative ticks did bottom out but are now turning around. A/D lines are at very bearish levels (almost -2000 on the NYSE and -1700 on the Nas). I think we will retest the lows on the ES at 1108 but I don't think there is enough selling to break it. Volume is up and a lot heavier than yesterday but only slightly below the 30 day median average.
I'm going to enter into some OEX put BWB's but not for this week but August expiration which is next Friday. I think the worst the market can do is go sideways from here. I still like the 505/500/490 strikes. Volatility is up but not really seeing a rise in the skew which is a good sign for the bulls (it means the selling is pretty orderly).
I'm going to enter into some OEX put BWB's but not for this week but August expiration which is next Friday. I think the worst the market can do is go sideways from here. I still like the 505/500/490 strikes. Volatility is up but not really seeing a rise in the skew which is a good sign for the bulls (it means the selling is pretty orderly).
Monday Session Recap
Markets grinded higher again yesterday. On the market internals we saw NYSE A/D line at +1400 and breadth at 70%. Strong bullish sentiment as well with cumulative ticks finishing at +70,000 which is a very bullish number. Only downer for the bulls was all of this came on the back of very, very low volume (I'd say close to multimonth lows) so it's telling me that there is still a great deal of uncertainty about making any big bets going into the Fed meeting. Overall, I see the path of least resistance as higher at this stage but the price action would say that perhaps we might need a bit of a pause or a pullback to get another leg up. There is mostly a lack of conviction in this market at this price level which would be in agreement with some of the sentiment out there. It will probably take another big push up to convince all the fence sitters that this market is indeed going higher.
On the trades front, I did not manage to get filled on my OEX put BWB (strikes at 510/505/495) and on an unbalanced fly (1/3/2) at 505/500/495. Actually I took some positions off such as my AAPL earnings BWB (for $1.79 credit) and my GS earnings BWB (a paltry $0.11 credit). I have a very light position on the RUT (short some put spreads) and have the ZB iron condor (which decayed a bit over the last few days). Overall I'm like everyone else, waiting for the next move or waiting for the market to give me some kind of edge. I'm still cautiously bullish on this market.
On the trades front, I did not manage to get filled on my OEX put BWB (strikes at 510/505/495) and on an unbalanced fly (1/3/2) at 505/500/495. Actually I took some positions off such as my AAPL earnings BWB (for $1.79 credit) and my GS earnings BWB (a paltry $0.11 credit). I have a very light position on the RUT (short some put spreads) and have the ZB iron condor (which decayed a bit over the last few days). Overall I'm like everyone else, waiting for the next move or waiting for the market to give me some kind of edge. I'm still cautiously bullish on this market.
Saturday, August 7, 2010
Friday's session recap
There was quite a big gap down pre-market on Friday when the jobs report came out but sellers could not push the market lower as the market held. As you would expect, the market internals were pretty weak to begin with but as has been the case of late, they improved throughout the session. Cumulative ticks only ever got to -5,000 before going sideways and eventually trending higher closing at around 40,000. That's a pretty decent number given what transpired. Finally volume came in well above the previous couple of sessions but was just slightly above the 30 day median average. Lots of volume was transacted at the lows of the day, which corresponded to trend line support on the daily chart (see below). From the looks of it, it seemed like an easy entry point for bulls to get long.
 Unfortunately, I was out and unable to trade on Friday morning so I did not get the opportunity to enter into a OEX weekly put BWB for next week. It would have been nice to have done on the open so given what transpired. It's more than likely that both volatility and skew would have been up which would have helped entry into the trade (trade for a decent credit). We shall see what happens this week but judging by the action this market still wants to move higher.
Bonds were up in line with the weak jobs number so the equities up and bonds up relationship still continues.

Bonds were up in line with the weak jobs number so the equities up and bonds up relationship still continues.
Trading and Performance Part II
Ok so by now I’ve read enough of the book so as to not try and rehash it (it’s just too hard and wouldn’t do justice to it), so I’m going to summarize what I’ve read so far (including my own interpretations) and try to use some trading examples in the process. (Click here for the link to my first post on this). Once again I reiterate that if you want to achieve high performance at anything (and who wouldn’t) then you need to read this book!
The ingredients crucial to developing great performance are:
Well they are my main takes after reading the book but what about some tips to speed the whole process up? I mean what is most efficient way to get really good at something? I'm drawing on my own experiences here but these are my tips.
1. They know more. But we knew that already. Enough said!
2. Perceive more with less - because they are so much more efficient at analyzing relevant information.
3. Remember more - By virtue of having highly developed mental models, the ability of the brain to recall well organized information is far superior to other people.
Well hopefully the information I described is structured well enough for you all to develop a good mental model of what it takes to achieve high performance. Let me know if the light bulb was on whilst you were reading it. I sure hope so!!
The ingredients crucial to developing great performance are:
- Developing deep domain knowledge – This is a no brainer. If you want to be an expert on something then you need to have extensive knowledge on it. Ie if you want to trade options, you should read as many option theory/trading books you can (although after a while, they’ll all start sounding the same). You shouldn’t stop there though as you will be trading in the markets so therefore you need to understand the markets and how they work. This means reading market related books and this is an infinite list. The last thing is understanding yourself and your own psychology as you are the one pulling the trigger so you need to be self conscious of your behavioral patterns and perhaps modify them if they are detrimental to your trading. An example of developing deep domain knowledge is if you are learning about option volatility, then you should have a very good understanding of how the VIX is calculated, what the VXV and VXX are etc etc and how they are related.
- Creating highly developed domain mental models – This is called building and completing the jigsaw puzzle. Great performers not only have very deep domain knowledge, they have over time been able to use the knowledge to construct a vivid mental model. There is no point knowing all this knowledge as in point number one if you cannot create a logical structure for where everything fits! It’s like learning all the parts in a car but not knowing how it all fits together. Thus when given a new piece of information you will not know where it goes and how it affects the other parts (the important concept here is that you are trying to build a model to match inputs with outputs). A trading analogy would be knowing how to construct a bond option butterfly but not knowing what factors affect the bond price (ie monetary policy, inflation etc etc). Or learning how to trade options but not knowing anything on the greeks. Great performers have very rich mental models. They use it to build upon their already deep domain knowledge. This is like creating a filing cabinet of where to put your knowledge. It’s the difference between remembering random letters of the alphabet and learning words in the English language. A highly developed mental model also helps great performers to separate the relevant from the irrelevant information (this is like a novice trader reading the entire wall street journal while a seasoned trader only reads a few articles because he knows which are more relevant to trading). More importantly a highly sophisticated mental model allows you to predict the future as your brain becomes efficient and accurate at analyzing multiple variables and predicting highly probable outcomes.
- Deliberate practice – is a targeted approach to get you to the next level. It’s comes from looking at the whole performance model and then looking at specific inputs to determine where improvement can be gained to get better performance. For example, Michael Jordan worked tirelessly in the gym just on his footwork in the "post" (back to the basket moves) and so it’s no wonder he was one of the best players in the game. Tiger Woods repeatedly hits balls that have been stepped on in the sand trap so when the rare time comes he does get into that situation he won’t lose that extra stroke that everyone else does. In trading, if you are learning about option volatility, you should be noting/calculating the daily skew and its changes as well as how volatility in general is changing. Perhaps you should also compare implied with historical volatility. If you do this enough times, you won’t even have to put them in a spreadsheet as your brain will begin to form a vivid mental model and you can probably do the math in your head from all that calculating and doing the exercise over and over. For myself personally, I saw a need to get better at my direction picking skills on top of what I already knew about trading options so I decided to day trade the e-mini futures for a few months as there is no better way to force yourself to get better at picking direction than trading an instrument where you only make money from getting direction right. Not only am I now better at picking short term direction because I picked up on the tools that short term futures traders use, but by pulling myself out of my comfort zone, the exercise has allowed me to learn about other realms of the market which all feed into both points number one and two above and allows me to continually refine the mental model that I have.
- Every performance has a well defined goal is and measurable - Top performers are in constant search of feedback so as to create benchmarks by which they can measure their performance. Fund managers in general are ranked on alpha and Sharpe ratios etc etc but great performers are even more specific than that. Great performers document everything so they can scrutinize every little detail (as a probable input for designing deliberate practice), which then goes back into the performance loop to continually refine their method/skill. Therefore the goals that you set should be as specific and measurable as possible so the results are clear. In trading it's not just all about the bottom line but more about getting the processes right (ie have I followed my plan, done my due diligence etc etc)
- Repeat, repeat and repeat some more – We’ve all heard the saying that practice makes perfect. This is definitely true and the funny thing is when you do something enough times, your body and brain begin actually begins to adapt to make you more efficient at it. When combined with some sort of feedback (comparing outputs to inputs) then this can lead to pattern recognition. A trading example would be that someone who has a good education in classical chart patterns may begin to pick up on the tone of the overall market just by looking at lots of charts day after day, week after week. (Some top traders are known to look through 1000 to 2000 charts a week). It's quite plausible that they will be programming into their brains some sort of subconscious pattern recognition. Again it's all tied back to the previous points and probably arises because the mental model they have is so complete that it becomes extremely sensitive to the subtleties that they see. Top chess players for example, have studied all the different chess moves/scenarios so much that they can play blindfolded against multiple opponents because once the positions are described to them their brains instantly recognizes the pattern that they've seen so many times from all the studying and playing which is why they automatically know what move to take next. I posit that it's much like how market makers who stare at option prices all day looking at put call parity pricing, pricing straddles, strangles, boxes, reversals and conversions begin to develop a feel when something is amiss just through the tiniest discrepancy in the pricing. Or how about great day traders that have learnt market structure (again you need structure for reference & feedback), and that have put so many hours looking at the one minute bars forming on the screen that it allows them to take the highest probability set ups because they recognize the probable market structure so early (when combined with looking at other things like market internals etc etc).
- Responsibility - Great performers take full responsibility for their performance. This is empowering because it says that nothing is out of their control which means that there can always be room for further improvement.
Well they are my main takes after reading the book but what about some tips to speed the whole process up? I mean what is most efficient way to get really good at something? I'm drawing on my own experiences here but these are my tips.
- Seek knowledge that gives rise to distinction so that your mind can create structure to help develop your mental model. This is information that helps you to classify/categorise stuff. For example there was an example in the book describing how pro-tennis players are so much better at returning really fast serves not just by having better reflexes and reaction times than the rest of us (research shows that there is a human limit to this and that further practice yields very little improvement ie 80 – 20 rule) but because they have acquired the knowledge or more correctly the distinctions as to anticipate where the serve is going before the ball is hit by looking at the server’s toss, angle of hips, rotation of the arm etc etc. These are things that are not distinct to an amateur tennis player. For someone dieting, how about the distinction that Calories has no relationship to the volume of food (ie a doughnut has more Calories than a 1kg bowl of cucumber). Would that bit of information help if you were trying to lose weight? I would think so!! What about a trading example? Well how about the concept of weighted vega? I’ve been trading options for 5 years and had no understanding of this until, it was pointed out to me late last year. Now I know that front month vols react faster than back month vols and how that can affect my option trades. This has been a big revelation and has really helped to increase my mental model of options. There are numerous examples of these distinctions. You know it when you have one of those "ah ha" moments, like the light bulb just came on inside your head. One should be able to know how good some piece of information is because the light bulb should be constantly lighting up in your head. Thus you should be able to determine whether a book is worth reading just by skimming the contents for these "ah ha" moments.
- Seek out knowledge experts and make them your mentor - this is pretty self explanatory and I've mentioned it before. Just like in point number one, a good mentor/coach should be one that imparts knowledge to you in a way that builds the mental model. ie there should be some structure to it.
- Knowledge immersion and staying abreast of the current body of knowledge. In trading this would be similar to participating in discussion groups, trading communities and reading current blogs from top traders etc etc. Experts are always the ones that are at the forefront of the most up to date thinking. If you want to be one of them, then you have to do the same! Books are great for theory but they lose their practical value because they are not current.
1. They know more. But we knew that already. Enough said!
2. Perceive more with less - because they are so much more efficient at analyzing relevant information.
3. Remember more - By virtue of having highly developed mental models, the ability of the brain to recall well organized information is far superior to other people.
Well hopefully the information I described is structured well enough for you all to develop a good mental model of what it takes to achieve high performance. Let me know if the light bulb was on whilst you were reading it. I sure hope so!!
Subscribe to:
Posts (Atom)