One trader's personal insights and thoughts about trading the markets through market structure, logic and intuition.
Wednesday, June 8, 2011
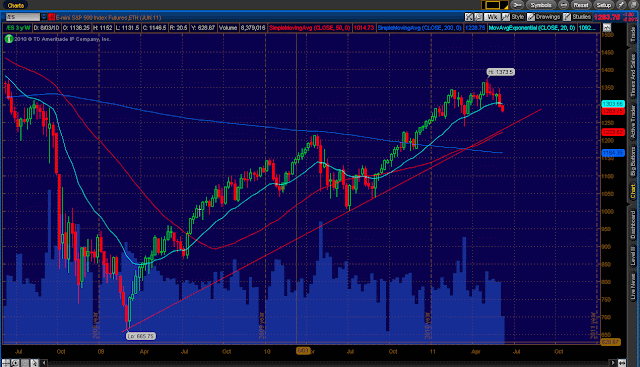
Date with the longer term trendline?
As an intra day trader it's very useful to zoom out and get a longer term perspective. Sometimes we are so caught up with the intraday action that we fail to see the forest and only the trees. So here is a weekly chart of the ES since the bounce off the March 2009 lows. Trendline support on the chart is around the 1250 area which also corresponds roughly to where the 200 day moving average is. One of the easiest scalp trades for an intra day trader is to pay attention to these particular price levels on a longer term time frame as they are normally very high probability areas for price inflection as other time frame participants come into the market at these levels. Therefore you can easily pick up a nice scalp play and if using multiple contracts setup a few for the scalp and hold one or two for a longer term position.
Tape action still looks decidedly weak and we have not the usual flush out and spike in fear (usually VIX is the most common measure) that we see in a typical bottom. Yes we are selling off but no one seems to be buying insurance?? Is that because big institutions are actually getting out of core long positions (ie no need to hedge?)
Whatever it is, looking for good entries to get short is still the MO on a intra day level. The last few mornings in the S&P 500 futures pit, we have seen that there has been mostly paper selling on the open forcing locals to go long, who after pushing the market higher have been unable to find a lot of paper buying indicating a lack of conviction from the bulls at this stage.
Subscribe to:
Post Comments (Atom)

No comments:
Post a Comment