Thursday, June 30, 2011

RUT position

I have now spreaded this position off so it looks like this.


I'm still bullish on the markets especially given that we were able to take out last weeks highs (ie pattern of higher lows, and higher highs) and the very strong tape readings for the last 4 days including today (currently cumulative ticks at +40,000 and trending straight up!). I just think we might consolidate here a bit given that we are very short term overbought now. So with that I had to weigh up the theta decay in my position if I didn't spread it off versus how much more the market may move in the next 2 weeks. Of course given the speed of the market in the last 2 years, I could be made to look silly. Hopefully I will gain a bit with the theta to come out for the Independence day long weekend.

I have also adjusted the OIH trade as well. I bought 2 x the 152/154 call spread to give myself a bit more upside profit. The trigger was that OIH has broken resistance on the daily down trendline. Again I'd like to see markets move a bit slower here but who knows. We've moved a whopping 10 points in just 3 days!

Wednesday, June 29, 2011

Current trades

The other day I mentioned that I started to dip my toe to the bullish side by establishing some long option positions. Here is how they look today.

This OEX position consists of two BWB's at different strikes (565/560/550 & 560/555/545). It can also be thought of as an unbalanced condor by being long the 565/560 put spread and then short the 555/550 and 555/545 put spreads. This is a weekly position and both BWB's were initiated for $0.50 and $0.30 credits respectively. Here's hoping for some fireworks today with the Greek votes as this spread is likely to finish well out of the money.

 This position again was originally 2 BWB's at different strikes (780/770/750 & 770/760/740). Since then I took some risk off by buying the 750/740 put spread for $0.65 debit. I have also bought the 835/845 call spread for July for $2.35 with the intention of spreading this off by selling an out of the money call spread eg. perhaps the 2 x 855/870 call spread for at least $1.25 such that I have a quasi unbalanced condor again and the call spread is totally financed by the short call spreads.


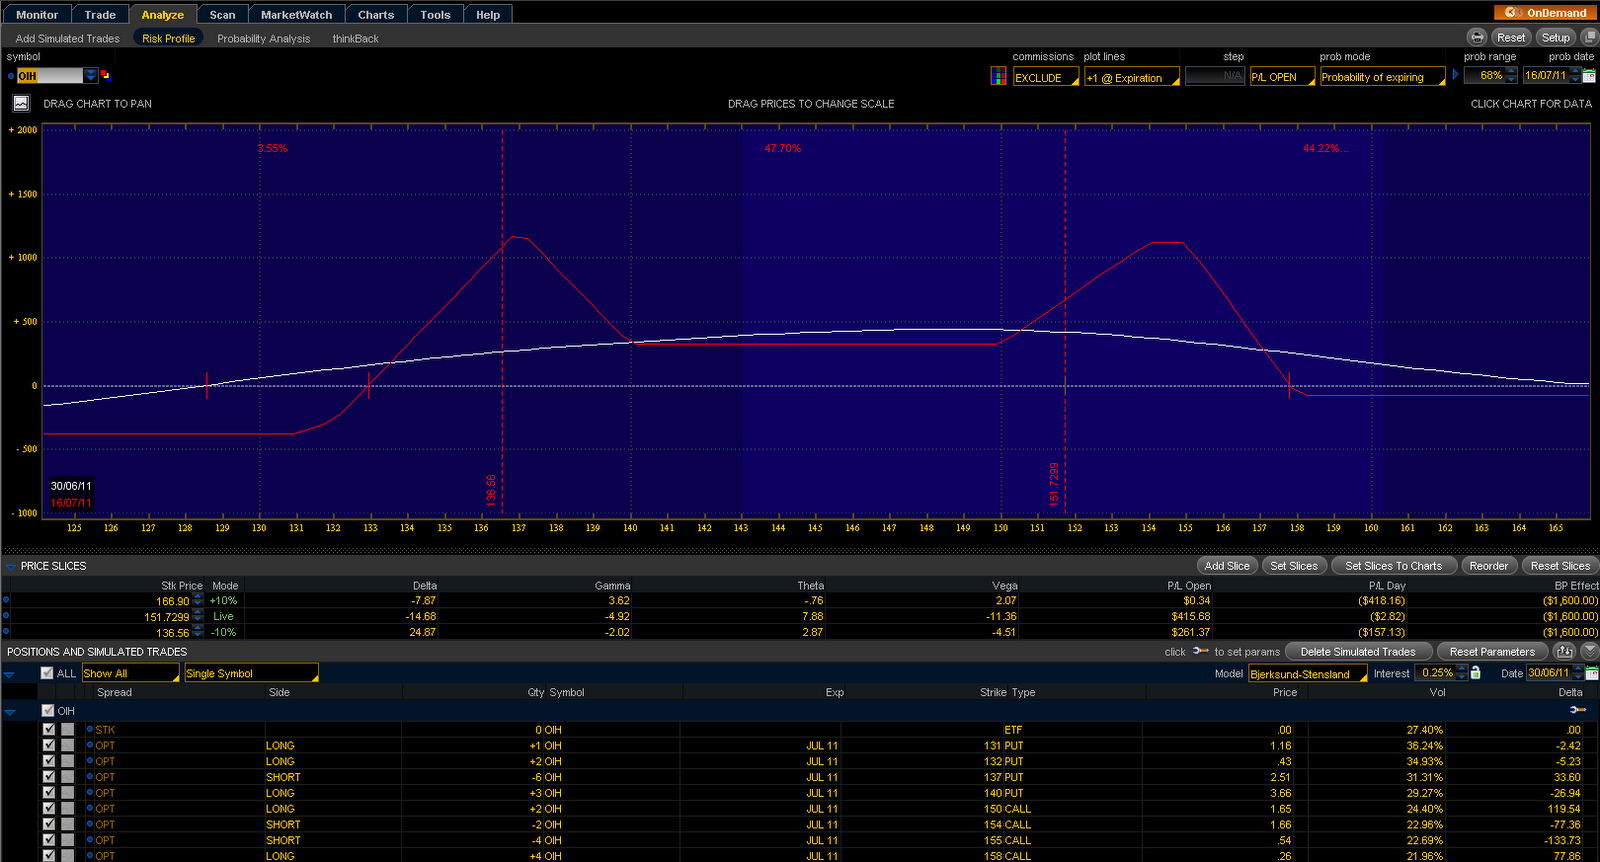
Again this OIH position began as a BWB. Since then I've spreaded that position off with an unbalanced condor. The strikes chosen coincide with previous swing highs at 155. This position is for July expiration. 

The only other trade I have on are some VXX puts at the 24 strike for Sep expiration. This trade is working out nicely having bought them for $3.25 (now trading at $3.75).

Thoughts for this morning are that this gap will probably fill given the buy the rumour sell the news play is likely (institutions love doing this!)

Friday, June 24, 2011

Huge turnaround

Quite a prescient call at about 11.30am ET when I called out that we were likely to have a large move up or down just by the amount of business that we were doing at the 1260 level on the ES. Fortunately for me, going long was the right call. The reasons why I went long was because:

  1. Market internals were improving (cumulative ticks finished at +35,000 on the session).
  2. ES was holding the 1260 trendline
  3. Divergence between small caps & technology (relative strength) versus the Dow and SPX
On the trade front, I ended up buying broken wing butterflies on the OEX, RUT and OIH. I had wanted to get more long by buying RUT call spreads but my fear or prudence held me back. This is something I need to work on as it's kinda of holding me back to transition to the next level (ie even though I could see that going long was the right play in terms of probability for the reasons above I managed to wuss out). Anyway something else to note down in my trading diary!

Thursday, June 23, 2011

Holding the daily trendline support on the ES @ 1260

Big fight going on at this area. SPY volume is running extremely high (80% above 30 day median) whilst cumulative ticks have been oscillating up and down. Whatever the next move is, it will be either a very sharp move up or down. I've decided to take a dip to the long side by establishing some longer term positions using BWBs on the OEX, OIH and RUT. Stay tuned.....

Tuesday and Wednesday recap

Cumulative ticks finished up at +80,000 and +50,000 respectively on both Tuesday and Wednesday. We  had the pre FOMC bias up till 2pm and then we sold off after there was no QE3 mentioned by Bernanke. Nothing like buying the rumour and selling the fact as always on FOMC day. This morning we have had weak unemployment claim numbers and are see monster gap downs below yesterday and the day before. Not a pretty situation and it could get ugly as these types of days usually turn into gap and crap (ie go with the gap trend days). I wonder if Goldman knew this was going to happen (they had a big sell order in the pit yesterday at the 1291 level - sold well over 1000 cars (just poking fun here)). Anyway they took away my blogging rights at work so expect later posts than normal.

Tuesday, June 21, 2011

Powering ahead

Anyone that was still short today is getting squeezed! Cumulative ticks are trending straight up, internals are strong. Classic trend day. The moves up in the futures has been nothing short of breath taking since the open.

Short covering rally?

Pre-market weakness was bought yesterday and the down gap we had was filled within the hour. It looks to me that that was a retest of sorts for Thursdays lows. We did manage to break the 30min trend line and hold the 1260 area which I was thinking was a good spot to get long. We'll have to see whether we get continued follow through as I suspect the buying was also due to a bit of short covering and some new longs taking a stab before the Greek Confidence Vote later tonight and the FOMC announcement on Wednesday (positive seasonality heading into it). Certainly no one wants to be on the wrong side of either of these potentially market moving events (especially if Bernanke mentions or implies that QE3 might be on the cards).

Cumulative ticks finished at a very respectable +50,000 yesterday and breadth indicators were ok. SPY volume was a little bit below the 30 day median average so make of that what you will. It really is a wait and see kind of market now and I don't really expect a major move early in today's session until the Greek Vote goes through (I'm expecting and the market is expecting that the confidence vote will be ok and Greece will get access to further funds). As for FOMC Wednesday, I'm not sure if Bernanke will talk about more stimulus but we shall see. At this stage, I would think the bias has to be to the long side for now but expect things to be choppy. One noticeable thing is that yesterday was the first day in a while, where we did not get some type of afternoon sell off and we held into the close (which is a good sign for the bulls). More days like that and you might say the tide is beginning to turn.

Important levels on the ES are 1277, 1284 (resistance), trend line and pivot support at 1270. Further downside support is at 1260 with S1 at 1264. I'm expecting a pre-market pull back to the 1270 area which should set up a good long trade. Gap fade looks ok as long as we don't open below the open from yesterday.

Monday, June 20, 2011

Pre-market thoughts for Monday 20th June 2011

As I write this (2am E.T.) U.S. index futures are already showing large gaps down below Friday's lows (on ES). This is a situation that usually does not favour gap fill and certainly the data I have seems to support this.
With no clear resolution on the Greece situation all eyes will be on the unfolding situation in the Greek parliament where we have a debate and no confidence vote later in the week. The EU has put off any further discussion of payment for loans until early July. This leaves the market in a tough spot as it hates uncertainty thus it will likely be a very news driven and volatile market until such time things are sorted out.

More support for some bearish action today is the fact that there has been a tendency for mean reversion post OpEx. Thus given the slightly positive action on Thursday and Friday then we would expect weakness today. Therefore my bias today is to look to sell any rallies. 1260 shapes as an important level on the ES and if we can hold and break above the short term down trend line, then I would likely go long. Weakness below 1260 and I will think we will retest last weeks lows. At this stage it seems quite clear that we are going to retest the 200 day moving average again (on the SPX cash). Best bet is that we undercut the 200 day and perhaps close below it, going for the March lows of 1243 on the ES (this would also shake out a lot of the weak hands and reset us for perhaps the next leg up). Remember we have still to tag the weekly trend line on the ES yet. Interestingly most gurus and sentiment quants are advising that this is a good area to start building longer term bullish positions (1-3 months) with the caveat on watching how weak the price action gets (bail if it looks like cascading down lower). Myself personally I would probably want to see some follow through before establishing significant longs though but then again I'm an intraday trader so I don't really take longer term positions (I may put on some speculative bullish spreads using options though).

Saturday, June 18, 2011

Noon update

Cumulative ticks somewhat choppy but the overall trend is up. It would appear that Merkel's earlier statement has managed to calm the markets for now. Still things are on a knife's edge and Greece's fundamental problems regarding it's inability to pay off it's debt is not a short term fix but a long term one. There are definitely more spanners in the works here. For more on this read this link here.

Friday, June 17, 2011

Forgot to add....

Yes I forgot to add that yesterdays price action in the ES (and indeed most of the index futures) is bullish. This is the same pattern at Monday and the theory is exactly the same as stated in Monday's post. However the caveat remains that we have external events (namely Greece) that is casting a dark shadow over normal technical patterns (there is a saying that technicals rule in the absence of significant fundamental news). From a gap guide probability, so long as we don't open below yesterday's low in the ES, the win rates are neutral (coin flip setup) but profit expectancy is pretty good. Ok but not really great to be fading in my opinion. I'd rather wait and see what happens today.

We have tagged the 200 day MA, now what??

It was more of the same price yesterday as Wednesdays as the initial pre-market weakness and sell off after the Philly Fed numbers (which was much worse than expected) was met with buyers right in front of globex lows . There was also a fair bit of program trading accompanying this buying as again most intraday traders would have been thinking to get in on the short side after the Philly numbers. The futures got to a point where they came up against the hourly down trendlines (for the ES anyway) and a good battle went on at these levels. The false breakup/false breakdown algos were also at it and chopped it up for about an hour at these levels making it very hard going for the day traders looking to get long about the trendline and short if it failed. Overall, the market held up pretty well until about 11.30am and then the rotational trade back down started to occur as it did the previous day.

The ES and the SPX cash have now both tagged the 200 day moving average so that longer term downside target has been met. Whilst most sentiment measures and quant stats still indicate odds favoring higher prices from here, the worrying thing and what I call the X-factor is the Greece situation. In normal circumstances I would lean to be an intermediate bull from here but there is definitely caution as indicated by a significant rise in the VIX even on a day where most of the cash indices finished slightly up. This indicates a bit of fear still and that mainly revolves around the situation in Greece where there is still great uncertainty about how to resolve their debt problems. Credit spreads and CDS for the European sovereigns are at record wides and that fear is spilling over to the equity markets and other assets. There has been much talk that a default by Greece would trigger a full blown reactionary sell off as when Lehman collapsed. Under the hood, cumulative ticks last night finished at -60,000 after spending half the day above 5000 (collapsed after 12.30pm ET). Another interesting fact is that we've had 10 straight last hour sell offs. Normally the definition is that the first hour belongs to the amateurs and the last hour belongs to the professionals. If that's the case you can make up your own mind as to what that streak is telling you. I very much doubt that many traders will be holding longs into the weekend without protection (likely to be hedged as judged by the rise in VIX). Interestingly skew in the SPX puts has finally started to pick up and has now risen quite sharply at 148% (at the money compared to 10 delta put) compared to only 128% only a week ago. It could be that iron condors may start to look attractive again, with some protection of course. Other trades that may be worth looking into are ratio spreads and BWB's.

Thursday, June 16, 2011

How to play it from here?

Further to my previous post, the way to play it from a trading standpoint is to wait for confirmation before committing to either the bull or bear side from here. As I've said we are at an important inflection point here. Failure to hold the March lows with a strong close above it and we could get a sharp move further to the down side. Thus at this juncture, you should be lightening up on all longer term (longer than a day) positions if not totally in cash and wait to see who wins the battle here. Of course some speculative trades are would be ok but only if they have asymmetric payoffs (ie limited risk, unlimited reward eg. options). Otherwise I would keep strictly to intra-day trading (which is why I continue to favour this type of trading in the current market environment).

Wednesday 15th June 2011 Recap

Following on from my last post yesterday, cumulative ticks finished at -90,000 after fluctuating for the first 2 hours. From then on it was a steady trend down as the selling got under way. Volume was extremely heavy after 11.30am which was pretty much the time when the markets tanked. As you would expect, all the internals were very weak with breadth at sub -2000 and -1600 for the NYSE and Nasdaq respectively. Up volume to down volume was 10:1 negative on both exchanges as well. Furthermore the price action from yesterday's session does not reflect one that is likely to bounce today as indicated by the fact that there was no sharp rebound and price finished near the lows of the session. The fact that price spent so much time near the lows only reflects that the market is fairly valued on an intra-day time frame.

On a technical level, most major markets are now at very important points of inflection. eg. the ES is at the 200 day moving average, the USD is close to breaking an important resistance point, the Euro is precariously at prior swing lows, gold is close to breaking it's longer term trend line. So whoever wins at these price levels will probably determine what lies ahead for the next weeks and possibly months. I'd say that it's most likely that the USD rallies higher from here, as well as bonds given that we've seen higher highs and higher lows on an intermediate term time frame. Given these are both risk averse assets, that would spell further weakness in equities.

On the trade front I had to shut down my short RUT put spreads after my conditional order was hit and took a decent loss. My VXX trade has now flipped to a small loss but I'm inclined to hold given how it's structured and depending upon what happens here with the inflection points. I also have on an June OEX Put BWB with strikes at 565/560/550 which is showing a nice little profit but am hoping that we get a little bit more follow through and ideally finish somewhere close to 560 by tomorrow (expiration day) which is where the March swing lows are. That would make for a nice weekend if that happened!

Wednesday, June 15, 2011

The damn bots!!

Sometimes you have to think like the algorithms! After all the pre-market fear what did the market do? It basically sucked in more shorts and then ripped them a new one. From what I could see, most of the buying was done by the algorithms or the black boxes. Of course it makes sense, as all the weak hands would have sold pre-market and then new shorts expecting a continuation got squeezed getting their butts handed to them. Still we could see some type of afternoon reversal as most of the retail crowd is expecting the market to hold at these levels. Cumulative ticks have been a mixed bag oscillating between -5000 and -1000 showing wild swings in between. Trading today on the e-minis is likely to be dominated by the bots so it's not a really good environment to trade in unless you want to get chopped up.

Retest of the lows??

Worse than expected manufacturing data, combined with less than impressive employment numbers in the U.K and residual fears about Greece and the market is spooked yet again. With the large down gaps and the ES potentially opening below the lows (if it stays where it is) will set us up for another gap and go type of day. Psychologically this must be a huge blow to those that thought Monday was the bottom so don't be surprised if we get an avalanche of selling today.

Tuesday 14th June 2011 Recap

Well the gap and go scenario did play out as predicted yesterday. Cumulative ticks trended for almost the entire day except for the last 45 mins when the futures sold off (and on heavier volume might I add) and ultimately finished at +60,000. Internals were very strong the entire day. I would say that we've had a fair bit of short covering yesterday and although some traders established new longs, a lot of them also covered their longs by days end as evident of the futures selling off in the last hour. Most traders are now waiting to see if we can get some more follow through. I would be on the look out for perhaps a retest of Monday's lows if the bears reload again. We do seem to have lost the trendline support of the ES on the 15 min chart timeframe. Gap guides are looking good so long as the futures open anywhere above yesterday's open. Overall, I think we will get some type of a consolidation day so look to fade the extremes of the first hour opening range. I would think that going short may still offer the best risk to reward as it's still a very jittery market out there.

On the trade front, I did manage to sell some RUT put spreads on the open at the 775/765 strike for June expiration and I bought some VXX puts on Monday which are working out well.

Tuesday, June 14, 2011

Monday 13th June 2011 Trading Session Recap

WOW! Cumulative ticks finished at a whopping -240,000! So despite the major indices finishing flat, underneath the surface the sentiment was extremely bearish as more stocks were getting hit on the bids than the ask. Interestingly though, Rennie Yang of Market Tells (one of my quant subscriptions and where I get my cumulative tick data) points out that when we don't get a major sell off (>1%) on a day where cumulative ticks exceed negative 100,000 that usually points to higher prices one month later. Just in case you were wondering, the average sell off that accompanies a negative 100K plus tick reading is a whopping 4%. From a market auction theory point of view, the fact that we made a sharp and sudden sell off into the 1259 low on the ES followed by an equally sharp bounce represents that the 1259 area is below value as regulated by time. An analogy of this is if your local bike shop had a bicycle on sale that is below value (below cost) than time would regulate that opportunity either through the fact that the sale is for a limited time only or the bicycle is sold completely out of stock. The quick and sharp rebound from the 1259 area indicates that there is an area where buyers think that the market is below value and thus the opportunity to go long at these levels was quickly gobbled up. The stage is set then for further short covering and to see whether there will be initiative buyers coming into the market. Other factors supporting a short term bounce is that a number of key sectors like industrials, technology and energy are at key support levels (previous swing lows) also financials have stabilized over the last 3 days. There has also been a decrease in the number of new 52 week lows on both exchanges so that indicates that the selling pressure is subsiding.

Gap stats also show that it's less than favourable fading the large gaps we already see in the overnight futures so that's another sign that we might see a gap and go type of day.

Monday 13th June 2011 morning update

Although price has held up pretty well thus far, cumulative ticks have steadily trended lower for the first 30mins and we are at -20,000 already.

Monday, June 13, 2011

Almost there..

Well it was another down day on Friday as price action was very weak. Cumulative ticks finished at -90,000 and volume was extremely heavy (SPY volume was about 40% above the 30 day median level). We have failed to make any meaningful bounce and it is likely we will be retesting the 200 day moving average area soon (around 1250 on the ES). Quants are mixed with some calling for a bounce whilst others are suggesting more downside. More later......

Thursday, June 9, 2011

Another dismal performance underneath the surface

Cumulative ticks finished at -70,000 on Wednesday and this comes on top of -60,000 on Monday. So under the surface it is evident that the sentiment is quite bearish (bids are being hit more than asks). There's also been an expansion of 52 week lows in SPX components (15) and this is greater than the number we experienced at the March lows (8) when the SPX was a tad lower so one can infer that a fair bit of tape damage has been done if it wasn't obvious already. Still the market remains oversold and most quant data is still calling for some kind of bounce (we should have bounced 2-3 days ago) so we are really entering a space that is outside of historical norms. I suppose the longer we go without a bounce the more people are inclined to buy expecting a bounce. The worrying thing is that the tape action and slow grind down is not in my experience a pattern that has been suggestive of a strong bounce in the past. Bounces on an intraday level have been weak (mostly look like short covering) and if that is the general pattern then expect a daily bounce to be the same.

Wednesday, June 8, 2011

Date with the longer term trendline?


As an intra day trader it's very useful to zoom out and get a longer term perspective. Sometimes we are so caught up with the intraday action that we fail to see the forest and only the trees. So here is a weekly chart of the ES since the bounce off the March 2009 lows. Trendline support on the chart is around the 1250 area which also corresponds roughly to where the 200 day moving average is. One of the easiest scalp trades for an intra day trader is to pay attention to these particular price levels on a longer term time frame as they are normally very high probability areas for price inflection as other time frame participants come into the market at these levels. Therefore you can easily pick up a nice scalp play and if using multiple contracts setup a few for the scalp and hold one or two for a longer term position.

Tape action still looks decidedly weak and we have not the usual flush out and spike in fear (usually VIX is the most common measure) that we see in a typical bottom. Yes we are selling off but no one seems to be buying insurance?? Is that because big institutions are actually getting out of core long positions (ie no need to hedge?)

Whatever it is, looking for good entries to get short is still the MO on a intra day level. The last few mornings in the S&P 500 futures pit, we have seen that there has been mostly paper selling on the open forcing locals to go long, who after pushing the market higher have been unable to find a lot of paper buying indicating a lack of conviction from the bulls at this stage.

Monday, June 6, 2011

Perfect place to bounce?

ES futures hanging right at the last swing low and holding. If there was ever a good risk to reward, defined risk trade then this would be it. ie Go long here for a multi day trade with a tight stop at just below 1291. Again I do believe that we aren't heading into a bear market (not with ten year bonds returning 3.1% versus the trailing earnings yield on the S&P500 returning 6.2%). Of course they are based on trailing estimates so the forward estimates may begin to come in weaker especially with all the weaker data points coming out. It will be an interesting session today methinks. Gap fade probabilities are somewhat mixed for this zone here so we still have to respect the fact that the short term and intermediate trend is down.

Thursday, June 2, 2011

Blood bath yesterday

Needless to say a wrap up of the internals were ugly yesterday. Cumulative ticks finished at -90,000 (the graph looked like a slippery dip), breadth both finished at extremely bearish levels on the NYSE and Nas (sub 2000 and 1800 respectively) and up volume/down volume was 20:1 negative on the NYSE and 10:1 on the Nas. SPY volume finished 40% above the 30 day median average so very heavy.

Last nights price action leaves us back below the down trend line on the daily chart which was broken for a brief moment (a day and a half). Again where does that leave us? Well the tape action would suggest that we are indeed in the early stages of forming a rounded top. The fact that price has struggled to regain the strong bullish trend we've had for the last 2 years is suggestive of that. Note that we had two up gaps that did not fill which is normally a very bullish setup for the intermediate term. However last night we did manage to fill the previous day's gap (this has only happened 25% of the time (unfilled gap filling the next day) according to Scott from masterthegap.com). If the market was undervalued we would have expected the bulls to show up and hold that gap. The fact that we didn't even get a whimper tells you something. In fact this has been my tone of my posts for the last few weeks. Something just isn't the same anymore with the market. Bounces have been weak and that is telling.
In the short to medium term I would expect range trading strategies to work best. Interestingly, one observation from yesterdays action was that the dollar tanked ALONG with equities. This has not been the norm of recent years and would indicate that the market is now pricing in fundamental weakness in U.S. growth and possibly further stimulus from QE3 or similar as the Euro, oil and gold all held steady on the session. Bonds absolutely rocketed which is not a sign of a market that is worried about inflation or growth. Note that the bond market has for the last 6 weeks been trending steadily higher. I always regard the bond market as something of a leading indicator as I regard bond investors to be more astute than the masses that typically trade equities (more retail than institution).

The market remains very news driven at this point so stay nimble.